

Conventional market demand (domestic, commercial and industrial markets) has retracted by 0.8% overall. The electricity generation market has notably retracted (19%), as a result of increased electricity generation with coal (+96.5%) and electricity demand reduced by 2.1% according to REE.

As opposed to what took place in 2010, with a hydraulic production increase of over 50%, rainfall patterns in 2011 were lower, which resulted in 24% less hydroelectric production.
If the 2010 analysis highlighted the increase of renewable energies as an exogenous element that forced the retraction of gas use in combined cycles (renewable energy production directly entered the daily market), in 2011 it was the increased use of coal that partially displaced gas cycles. Remember that Spanish coal has been publicly subsidised since March 2011. It must also be highlighted that imported coal consumption in power stations has also increased. In the first case, demand grew by 85% and in the case of imported coal, demand grew by 120%.
Throughout the entire year, pipeline exports surpassed 11,000 GWh, which is 11% below the 2010 figure. However, international LNG loads were 7,946 GWh, compared with 77 GWh in 2010. This is a very significant increase, which raised all international sales to 19.1 TWh, compared with 12.6 TWh in 2010, with an increase of 52%.
- MARKET
- 1. RESIDENTIAL-COMMERCIAL
- Natural gas
- Gas manufactured from NG
- 1.1 Subtotal natural gas
- Propane-air mix
- 1.2. Subtotal other gases
- 2. INDUSTRIAL
- 3. ELECTRICITY PLANTS
- 4. NON-ENERGY USE
- 5. TOTAL NATURAL GAS (1.1+2+3+4)(*)
- TOTAL (1.2+5)
- TOTAL Sales of natural gas (bcm)
- 34.755
- 34.221
- 31
- 34.253
- 502
- 502
- 144.994
- 10.379
- 6.131
- 195.756
- 196.258
- 16,8
- 56.425
- 55.856
- 0
- 55.856
- 568
- 568
- 202.278
- 111.320
- 6.199
- 375.653
- 376.221
- 32,3
- 59.617
- 59.044
- 0
- 59.044
- 573
- 573
- 197.256
- 187.534
- 5.033
- 448.868
- 449.441
- 38,6
- 55.945
- 55.497
- 0
- 55.497
- 448
- 448
- 180.264
- 160.888
- 4.874
- 401.523
- 401.971
- 34,5
- 64.328
- 64.279
- 0
- 64.279
- 49
- 49
- 194.089
- 135.625
- 6.131
- 400.125
- 400.174
- 34,4
- 52.387
- 52.387
- 0
- 52.387
- 46
- 46
- 203.626
- 109.875
- 6.318
- 372.207
- 372.253
- 32,0
- MARKET
- RESIDENTIAL-COMMERCIAL
- INDUSTRIAL
- ELECTRICITY PLANTS (1)
- NON-ENERGY USES
- TOTAL
- 16,1
- 57,6
- 25,6
- 0,6
- 100,0
- 16,6
- 71,9
- 3,7
- 7,9
- 100,0
- 18,9
- 73,6
- 0,9
- 6,6
- 100,0
- 17,5
- 74,1
- 5,3
- 3,1
- 100,0
- 13,8
- 49,9
- 34,8
- 1,5
- 100,0
- 13,2
- 43,9
- 41,8
- 1,1
- 100,0
- 13,8
- 44,9
- 40,1
- 1,2
- 100,0
- 16,1
- 48,5
- 33,9
- 1,5
- 100,0
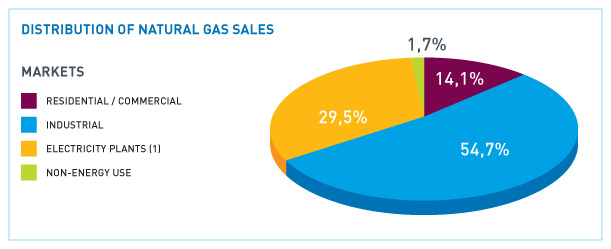
- 14,1
- 54,7
- 29,5
- 1,7
- 100,0
- MARKET
- 1. RESIDENTIAL-COMMERCIAL
- Natural gas
- Propane-air mix
- 2. INDUSTRIAL
- 3. ELECTRICITY PLANTS
- 4. NON-ENERGY USES
- 5. TOTAL NATURAL GAS (1.1+2+3+4)
- TOTAL (1.2+5)
- 7,0
- 6,6
- 41,1
- 9,2
- 115,0
- -5,5
- 14,7
- 14,7
- 10,1
- 10,4
- -15,3
- 9,0
- 46,3
- 5,8
- 13,3
- 13,3
- 8,9
- 8,8
- 9,8
- 7,8
- 65,0
- -6,6
- 16,0
- 16,0
- 8,5
- 8,5
- 13,7
- 3,1
- 68,4
- 9,0
- 17,6
- 17,6
- -7,9
- -7,8
- -11,8
- -1,5
- 21,0
- -8,1
- 4,1
- 4,1
- 9,2
- 9,2
- 10,6
- 2,1
- 5,5
- 8,1
- 4,3
- 4,3
- 5,0
- 5,0
- 3,4
- -3,0
- 32,0
- -18,3
- 10,1
- 10,1
- -6,2
- -6,0
- -21,8
- -8,6
- -14,2
- -3,2
- -10,5
- -10,6
- 15,0
- 15,8
- -89,1
- 7,7
- -15,7
- 25,8
- -0,3
- -0,4
- -18,6
- -18,5
- -6,1
- 4,9
- -19,0
- 3,1
- -7,0
- -7,0