

The structure of consumed end-use energy remains stable, with a slight decrease of fossil fuels in favour of renewable energy.
Oil products continue to dominate end-use energy: they currently represent around 50% of the total consumption of end-use energy. Kerosene increased +7.4% whereas other products decreased: 5.8% for diesel fuel; 6.5% for petrol; and 9.4% for LPG (data accumulated to November).
The implementation of the expansion of the Repsol refinery in Cartagena will reduce imports of middle distillates by 30%. Spain imports growing quantities of diesel fuel and kerosene, as a result (in the first case) of the increased dieselisation in the vehicle population.
Natural gas, when employed directly as an end-use energy, recorded a 1% decrease, according to initial MINETUR estimates. This was due to external reasons, such as the mild winter temperatures and the lack of lively industrial activity. It reached 17.2% of end-use energy consumption in Spain, two tenths above that recorded in 2010.
Natural gas has penetrated the Spanish residential and commercial market less than the European average. This is due, in part, to the lower population density in Spain.
Over 2011, electricity consumption decreased by 2.9%, with demand diminishing by 2.1%, similar to figures recorded in 2006. The causes are again related to the mild climate recorded in the last part of 2011 and the economic crisis.
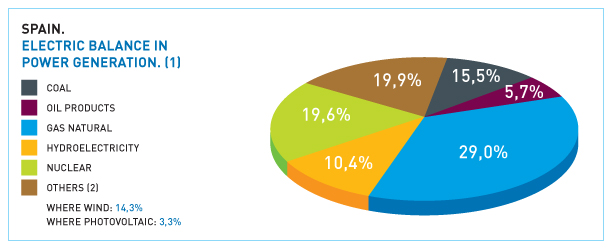
In accordance with REE data, the mix of electricity generation at power plants indicates natural gas had a 19.1% share, placed after nuclear energy, which reached 21.8%. Coal was placed third with a 16.4% share.
FINAL ENERGY CONSUMPTION IN SPAIN(1)
- Coal
- Oil products
- Gas (3)
- Electricity
- Renewables
- TOTAL
- 2.546
- 55.628
- 12.292
- 16.306
- 3.473
- 90.245
- 2.424
- 61.738
- 17.628
- 20.836
- 3.805
- 106.431
- 2.317
- 61.928
- 17.755
- 22.171
- 3.681
- 107.852
- 2.080
- 59.595
- 17.256
- 22.253
- 4.432
- 105.618
- 1.398
- 55.387
- 15.016
- 20.969
- 4.832
- 97.602
- 1.690
- 46.453
- 15.620
- 22.410
- 5.565
- 91.738
- 1.738
- 45.100
- 15.460
- 21.928
- 5.621
- 89.847
Source: Secretaría de Estado de Energía. Ministerio de Industria, Energía y Turismo.
- Coal
- Oil products
- Gas
- Electricity
- Renewables
- TOTAL
- 2,8
- 61,6
- 13,6
- 18,1
- 3,8
- 100,0
- 2,3
- 58,0
- 16,6
- 19,6
- 3,6
- 100,0
- 2,1
- 57,4
- 16,5
- 20,6
- 3,4
- 100,0
- 2,0
- 56,4
- 16,3
- 21,1
- 4,2
- 100,0
- 1,4
- 56,7
- 15,4
- 21,5
- 5,0
- 100,0
- 1,8
- 50,6
- 17,0
- 24,4
- 6,1
- 100,0
- 1,9
- 50,2
- 17,2
- 24,4
- 6,3
- 100,0
At the end of 2011, electrical power installed in Spain exceeded 100 GW, of which 26% was dedicated to natural gas combined cycles. Capacity was increased by 1,879 MW, with 93% stemming from renewable sources, 997 MW from wind energy and 674 MW from solar energy.
In 2011, a new combined cycle power plant was implemented in Ibiza. At the end of 2011, 67 combined cycle units were therefore operative, with a joint capacity of 26,251 MW.
Increased use of coal in power plants is not only the result of supporting regulations approved by the EC and the Spanish Government in relation to maintaining subsidies for loss-making mining companies. Imported coal also took centre stage, with consumption at power plants increasing by 120% when compared to 2010.
Joint production of electricity from renewable sources covered 33% of demand in 2011, three points behind the previous year, mainly due to the decrease in the generation of hydropower.
Hydropower generated 10.4% of the electricity mix in 2011. At the end of the year, equivalent water supplies reached 54% of total capacity, below the ratio recorded at the end of 2010, which sat at 66.3%.
- Coal
- Oil products
- Natural gas
- Hydroelectrity
- Nuclear
- Others (2)
- Where wind:
- Where Photovolt.:
- TOTAL
- 66.981
- 15.474
- 6.087
- 24.241
- 55.445
- 1.288
- n.d.
- n.d.
- 169.516
- 39,5
- 9,1
- 3,6
- 14,3
- 32,7
- 0,8
- --
- --
- 100
- 81.993
- 23.211
- 82.458
- 23.025
- 57.539
- 26.230
- 21.269
- n.d.
- 294.456
- 27,8
- 7,9
- 28,0
- 7,8
- 19,5
- 8,9
- 7,2
- --
- 100
- 38.069
- 18.455
- 110.004
- 29.184
- 52.761
- 47.829
- 37.887
- 6.067
- 296.302
- 12,8
- 6,2
- 37,1
- 9,8
- 17,8
- 16,1
- 12,8
- 2,0
- 100
- 26.342
- 17.046
- 97.015
- 42.367
- 61.990
- 58.168
- 44,166
- 7,105
- 302.928
- 8,7
- 5,6
- 32,0
- 14,0
- 20,5
- 19,2
- 14,6
- 2,3
- 100
- 45.542
- 16.659
- 85.253
- 30.545
- 57.670
- 58.374
- 42,060
- 9,598
- 294.043
- 15,5
- 5,7
- 29,0
- 10,4
- 19,6
- 19,9
- 14,3
- 3,3
- 100
(2) Biomass, municipal waste, wind and y solar fotovoltaic and thermal.
(3) Provisional data at 1.2.2012.
Source: Secretaría de Estado de Energía. Ministerio de Industria, Energía y Turismo.
The outcome for physical international exchanges reveals an export balance of approximately 8,500 GWh, suggesting a positive balance with all four neighbouring countries.
In February, the demand for electrical energy increased 5.8% as regards February 2009, 8.7% in March, 6.5% in April and 7.3% in November.
The initial months of 2010 were also significant in terms of the power from renewable sources. This can be explained by the strong increase in wind generation (40% in the first term, with instantaneous wind power generation standing at a record of almost 13,000 MWh, on February 24, for instance) and hydroelectric energy, with a 90% progression in the first third of the year (February was the wettest month in the last twenty years). This situation left limited breathing space for non-basic thermal generation, such as coal groups and natural gas combined cycles.
- INDUSTRY
- Coal
- Oil Products
- Natural gas
- Electricity
- TRANSPORT
- Coal
- Oil Products
- Natural gas
- Electricity
- SUNDRY USES
- Coal
- Oil Products
- Natural gas
- Electricity
- TOTAL by Final Energy
- Coal
- Oil Products
- Natural gas
- Electricity
- TOTAL by Sector
- INDUSTRY
- TRANSPORT
- SUNDRY USES
- 24.462
- 3.932
- 11.306
- 3.677
- 5.547
- 22.716
- 0
- 22.478
- 0
- 238
- 13.492
- 339
- 7.109
- 854
- 5.190
- 60.669
- 4.271
- 40.893
- 4.531
- 10.974
- 60.669
- 24.462
- 22.716
- 13.492
- 100,0
- 16,1
- 46,2
- 15,0
- 22,7
- 100,0
- 0,0
- 99,0
- 0,0
- 1,0
- 100,0
- 2,5
- 52,7
- 6,3
- 38,5
- 100,0
- 7,0
- 67,4
- 7,5
- 18,1
- 100,0
- 40,3
- 37,4
- 22,2
- 32.718
- 2.358
- 13.350
- 9.602
- 7.408
- 32.275
- 0
- 31.913
- 0
- 362
- 21.779
- 188
- 10.365
- 2.690
- 8.536
- 86.773
- 2.546
- 55.628
- 12.292
- 16.306
- 86.773
- 32.718
- 32.275
- 21.779
- 100,0
- 7,2
- 40,8
- 29,3
- 22,6
- 100,0
- 0,0
- 98,9
- 0,0
- 1,1
- 100,0
- 0,9
- 47,6
- 12,4
- 39,2
- 100,0
- 2,9
- 64,1
- 14,2
- 18,8
- 100,0
- 37,7
- 37,2
- 25,1
- 34.828
- 1.850
- 10.863
- 12.642
- 9.473
- 39.301
- 0
- 38.822
- 0
- 479
- 27.056
- 230
- 9.910
- 4.614
- 12.302
- 101.185
- 2.080
- 59.595
- 17.256
- 22.254
- 101.185
- 34.828
- 39.301
- 27.056
- 100,0
- 5,3
- 31,2
- 36,3
- 27,2
- 100,0
- 0,0
- 98,8
- 0,0
- 1,2
- 100,0
- 0,9
- 36,6
- 17,1
- 45,5
- 100,0
- 2,1
- 58,9
- 17,1
- 22,0
- 100,0
- 34,4
- 38,8
- 26,7
- 30.527
- 1.156
- 10.107
- 10.686
- 8.578
- 36.868
- 0
- 38.822
- 0
- 479
- 25.375
- 242
- 8.887
- 4.330
- 11.916
- 92.770
- 2.079
- 59.595
- 17.256
- 22.254
- 92.770
- 30.527
- 36.868
- 25.375
- 100,0
- 3,8
- 33,1
- 35,0
- 28,1
- 100,0
- 0,0
- 98,8
- 0,0
- 1,2
- 100,0
- 1,0
- 35,0
- 17,1
- 47,0
- 100,0
- 2,1
- 58,9
- 17,1
- 22,0
- 100,0
- 32,9
- 39,7
- 27,4
- 32.263
- 1,474
- 10.197
- 11.793
- 8.799
- 35.862
- 0
- 35.380
- 0
- 482
- 26.335
- 246
- 8.974
- 4.979
- 12..136
- 94.460
- 1.720
- 54.551
- 16.772
- 21.417
- 94.460
- 32.263
- 35.862
- 26.335
- 100,0
- 4,6
- 31,6
- 36,6
- 27,3
- 100,0
- 0,0
- 98,7
- 0,0
- 1,3
- 100,0
- 0,9
- 34,1
- 18,9
- 46,1
- 100,0
- 1,8
- 57,8
- 17,8
- 22,7
- 100,0
- 34,2
- 38,0
- 27,9
Photovoltaic energy has experienced a strong development in recent years, with a notable halt in 2010. Installed power (approximately 3,000 MW, equivalent to three nuclear power stations) has caused problems for the electric system operator, given the lack of instant information regarding actual production. In any case, it is another significant element for power generation during the central hours of the day, particularly during the hotter months.
- OF FINAL ENERGY
- Industry
- Transport
- Residential-Commercial
- IN R-C MARKET:
- Gasoil
- Natural gas
- Electricity
- In Domestic market
- 2.296
- 738
- 565
- 993
- 267
- 255
- 198
- 670
- 2.298
- 670
- 703
- 925
- 163
- 318
- 245
- 600
- 2,407
- 676
- 743
- 988
- 157
- 362
- 272
- 624
- 2.223
- 538
- 734
- 951
- 125
- 339
- 286
- 589
- 1.237
- 490
- 393
- 354
- 116
- 5
- 97
- 230
- 1.983
- 636
- 820
- 527
- 127
- 66
- 212
- 296
- 2.264
- 723
- 920
- 622
- 149
- 101
- 263
- 352
- 1.862
- 517
- 823
- 522
- 100
- 100
- 295
- 324
There is only one operative power plant outside Spain, which is located in Germany. Seven plants are being built outside Spain and 26 are currently in the planning stage. Spain has 16 plants that are currently operating, another 16 are in the construction phase and 32 are in the planning stage, as revealed by data provided at the 4th International Summit on thermo-electric solar energy staged in Seville in late November 2010.
The capacity for the biodiesel production in Spain stands at around 4.2 million tons, showing a 3% drop as regards the figure for the previous year. Said production only represents 10% of the plant capacity, according to sectorial sources. 60% of the biodiesel was imported, in some cases from countries with aids established for this purpose.
The development of electric interconnections between Spain and France is advancing according to plan (the first stage of the new interconnection was submitted for public consultation in October), and the new very high power line is expected to be operative in 2014.
As regards Portugal, between 2014 and 2015 interconnections between said country and Spain should suffice to ensure the single electricity market is operative at all times.
If we analyse the final destination of consumption using official data for 2009, the transport sector was once again last year the biggest consumer of final energy, accounting for 38.9%. In second place was industry, with around 31%, and in third position sundry uses (around 25%), with household consumption being the most significant.
As regards the evolution compared to 2008, the figures under study, and published in 2010, show the known drop in energy consumption in transport in 2009 (-6.2%), as a consequence of the increase in energy prices and the economic crisis. This situation also appeared in the industrial sector, where the total consumption dropped 11.6% in 2009.
If we turn to final consumption in Spain in certain specific markets, and compare this with the same average consumption for the EU, we find that in the residential market energy consumption per inhabitant in the EU is 72% higher than the equivalent in Spain, a difference resulting from the milder Spanish winters. It is interesting to note that in 1985 the average final energy consumption per inhabitant in the EU was 2.9% higher in the EU (data from EU 25 in this case) than in Spain.