

In the European ranking for the consumption of natural gas, Germany and The United Kingdom usually take turns being in the lead, with each country at about 90 bcm. Third place is taken by Italy with 80 bcm during the last year. The Netherlands get close to 50 bcm, as does France. In the United Kingdom, Italy and The Netherlands, natural gas constitutes around 40% of primary energy consumption.
The incident that most affected Europe’s drop in demand is the mildness of the last two winter periods. The drop in demand in the first quarter was 6% in Europe. In France, the drop was 12.1%, in Germany 9.4%, Italy 4.7% and the United Kingdom was at 15.7%.
Another factor that explains the drop in European global demand is the stagnation of industrial demand.
The stagnation of the European economy and the mild winter conditions are also elements that have conditioned the low electricity demand, and therefore the use of gas in power plants.
Within the countries that comprise the OECD, the residential-commercial market’s share proves lower, as, altogether, it is less mature than the European: it receives a little more than 32% of the total natural gas. The electricity generation market tops the OECD’s list, as it consumes roughly one-third of the total natural gas. As with the European Union, the industrial market slots into third place, with a similar share of 20%.
- United Kingdom
- Germany
- Italy
- France
- Netherlands
- Spain
- Belgium
- Romania
- Poland
- Hungary
- Czech Republic
- Austria
- Slovakia
- Denmark
- Finland
- Portugal
- Ireland
- Greece
- Lithuania
- Bulgaria
- Latvia
- Luxembourg
- Slovenia
- Sweden
- Estonia
- TOTAL UE 27
- 1,092,5
- 966,7
- 879,2
- 549,7
- 507,3
- 400,1
- 218,9
- 166,1
- 146,8
- 128,5
- 107,0
- 95,1
- 60,8
- 59,7
- 58,4
- 49,5
- 49,7
- 41,5
- 32,0
- 27,7
- 18,8
- 15,5
- 18,9
- 10,8
- 6,6
- 5.707,5
- 898,3
- 841,6
- 823,5
- 477,8
- 442,6
- 372,2
- 189,8
- 166,7
- 150,8
- 117,0
- 100,5
- 85,5
- 53,2
- 57,8
- 59,1
- 43,3
- 40,6
- 51,2
- 35,1
- 31,1
- 16,9
- 13,3
- 14,8
- 9,2
- 5,9
- 5.097,8
- -17,8
- -12,9
- -6,3
- -13,1
- -12,8
- -7,0
- -13,3
- 0,4
- 2,7
- -8,9
- -6,1
- -10,1
- -12,5
- -2,7
- 1,2
- -12,5
- -18,3
- 23,4
- 9,7
- 12,3
- -10,1
- -14,2
- -21,7
- -14,8
- -10,6
- -10,7
Source: Eurogas
- Residential-Commercial
- Industrial
- Non-energy use
- Electrical generation (1)
- Transport
- Other(2)
- TOTAL
- 39,9
- 24,5
- 3,3
- 28,2
- 0,1
- 4,0
- 100,0
- 40,5
- 22,8
- 3,3
- 29,1
- 0,1
- 4,3
- 100,0
- 39,8
- 21,8
- 3,4
- 29,8
- 0,1
- 5,1
- 100,0
- 40,2
- 20,9
- 3,1
- 30,9
- 0,1
- 4,7
- 100,0
- 38,2
- 21,6
- 3,5
- 32,0
- 0,2
- 4,6
- 100,0
- 36,0
- 19,9
- 3,2
- 34,0
- 0,6
- 6,3
- 100,0
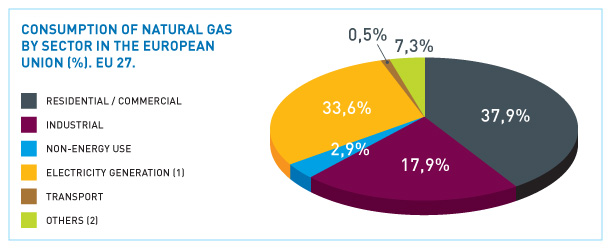
- 37,9
- 17,9
- 2,9
- 33,6
- 0,5
- 7,3
- 100,0
(2) Consumption by energy sectors and leakage.
Source: Energy Yearly Statistics. Eurostat. Since 2008, Energy Balance Sheets. Eurostat. EC.

-
 Naturgas
 -
 International Gas Union