

The worldwide gas trade already exceeds a third of the production. In 2011 international trade may have grown around 4.4%, according to Cedigaz estimates published in December.
Due to the increasing demand of LNG in Asia and the difficulty in supply from Libya and Algeria, exportation by pipeline from Russia to Europe grew substantially.
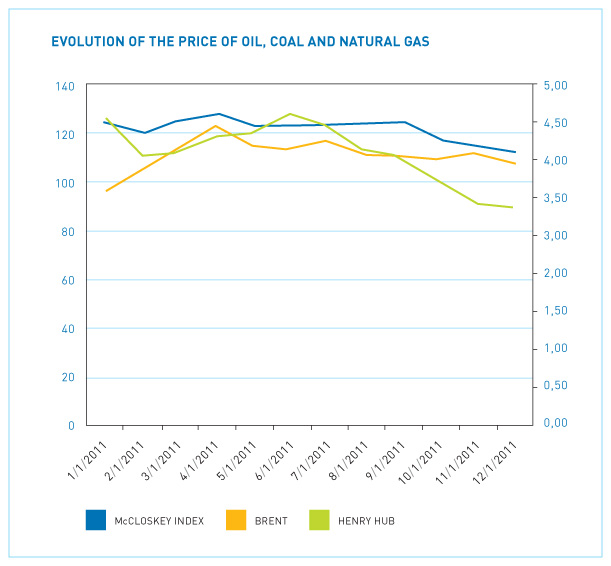
The rise of the price of oil products is accelerating in Asia, and they are being substituted for natural gas for generating electricity, and urea production for fertilizers.
The top spots for countries that export by pipeline in 2011 have not changed in relation to previous years, with Russia occupying the first spot (228.5 bcm), followed by Norway (90.8 bcm), Canada (90.5 bcm) and the Netherlands (48.3 bcm). Turkmenistan falls into fifth place with 46.5 bcm.
- 1970
- 1980
- 1990
- 1995
- 2000
- 2005
- 2007
- 2008
- 2009
- 2010
- 2011
- 45,7
- 201,0
- 307,4
- 391,7
- 630,5
- 861,7
- 933,4
- 969,5
- 912,9
- 1.015,2
- 1.077,4
- 4,4
- 13,2
- 14,9
- 17,8
- 25,8
- 30,6
- 31,6
- 31,6
- 30,5
- 31,6
- 33,5
- 43,0
- 169,6
- 235,3
- 298,5
- 492,8
- 672,8
- 706,5
- 743,6
- 670,4
- 718,9
- 750,9
- 94,1
- 84,4
- 76,5
- 76,2
- 78,2
- 78,1
- 75,7
- 76,7
- 73,4
- 70,8
- 69,7
- 2,7
- 31,3
- 72,1
- 93,2
- 137,7
- 188,9
- 226,9
- 225,9
- 242,5
- 296,3
- 326,5
- 5,9
- 15,6
- 23,5
- 23,8
- 21,8
- 21,9
- 24,3
- 23,3
- 26,6
- 29,2
- 30,3
Source: Cedigaz
-
- North America
- Canada
- USA
- Central and South America
- Argentina
- Bolivia
- Trinidad & Tobago
- Europe (1)
- Norway
- Netherlands
- United Kingdom
- Germany
- CIS
- Russia
- Turkmenistan
- Uzbekistan
- Africa
- Algeria
- Egypt
- Nigeria
- Libya
- Guinea Ecuatorial
- Middle East
- Abu Dhabi
- Iran
- Oman
- Qatar
- Asia - Pacific
- Indonesia
- Malaysia
- Australia
- Myanmar (Burma)
- TOTAL WORLD
- 129,1
- 101,8
- 27,3
- 32,8
- 17,4
- 11,8
- 1,0
- 185,8
- 95,7
- 54,5
- 11,5
- 14,6
- 315,4
- 237,3
- 55,8
- 15,1
- 114,5
- 59,0
- 16,9
- 20,6
- 10,4
- 4,5
- 87,5
- 56,8
- 11,8
- 10,9
- 4,1
- 104,2
- 36,0
- 30,2
- 20,2
- 8,6
- 969,3
- 122,6
- 92,2
- 30,3
- 32,9
- 19,7
- 9,8
- 0,9
- 181,3
- 97,2
- 50,3
- 12,2
- 12,4
- 264,2
- 201,7
- 24,8
- 21,7
- 104,1
- 52,7
- 18,3
- 16,0
- 9,9
- 4,7
- 101,3
- 68,2
- 11,2
- 11,5
- 5,9
- 106,5
- 34,3
- 30,8
- 24,2
- 8,3
- 912,9
- 123,6
- 92,4
- 31,2
- 37,3
- 20,4
- 11,7
- 0.4
- 194,4
- 100,6
- 53,3
- 15,7
- 14,8
- 294,3
- 224,6
- 30,7
- 21,4
- 112,9
- 55,8
- 15,2
- 24,0
- 9,8
- 5,2
- 136,4
- 94,9
- 12,1
- 11,5
- 8,4
- 116,2
- 41,3
- 32,0
- 25,4
- 8,8
- 1.015,1
- 12,2
- 9,1
- 3,1
- 3,7
- 2,0
- 1,2
- n.d
- 19,2
- 9,9
- 5,3
- 1,5
- 1,5
- 29,0
- 22,1
- 3,0
- 2,1
- 11,1
- 5,5
- 1,5
- 2,4
- 1,0
- 0,4
- 13,4
- 9,3
- 1,2
- 1,1
- 0,8
- 11,5
- 4,1
- 3,2
- 2,5
- 0,9
- 100,0
Source: Cedigaz
-
- North America
- Canada
- USA
- Central and South America
- Mexico
- Brasil
- Chile
- Argentina
- Europe (1)
- Germany
- Italy
- France
- Spain
- United Kingdom
- Turkey
- Belgium
- Netherlands
- CIS
- Russia
- Ukraine
- Bielorussia
- Africa
- Middle East
- Dubai
- Iran
- Jordan
- Asia - Pacific
- Japan
- South Korea
- Taiwan
- India
- Thailand
- TOTAL WORLD
- 128,9
- 113,0
- 15,9
- 29,8
- 13,9
- 11,0
- 0,8
- 1,3
- 448,9
- 87,1
- 76,9
- 49,3
- 39,1
- 36,5
- 36,9
- 20,7
- 18,0
- 147,4
- 56,2
- 56,2
- 21,1
- 5,1
- 35,3
- 14,2
- 7,1
- 2,7
- 173,9
- 92,3
- 36,6
- 11,4
- 10,8
- 8,6
- 969,3
- 126,7
- 105,8
- 20,8
- 28,9
- 13,2
- 8,4
- 1,5
- 2,7
- 428,9
- 89,4
- 69,3
- 47,1
- 36,0
- 41,1
- 33,8
- 21,5
- 17,0
- 114,6
- 45,0
- 37,3
- 17,6
- 4,3
- 39,5
- 14,2
- 6,1
- 2.9.
- 171,5
- 85,9
- 34,3
- 11,8
- 12,6
- 8,3
- 912,9
- 127,6
- 104,7
- 22,9
- 38,6
- 15,2
- 12,6
- 3,4
- 3,6
- 463,7
- 92,8
- 75,3
- 48,9
- 36,4
- 53,6
- 36,7
- 24,0
- 17,0
- 136,2
- 61,2
- 38,2
- 21,6
- 4,9
- 42,6
- 14,4
- 6.9.
- 2.5
- 201,5
- 97,1
- 45,0
- 15,2
- 12,2
- 8,8
- 1.015,2
- 12,5
- 10,3
- 2,3
- 3,8
- 1,5
- 1,2
- 0,3
- 0,4
- 45,7
- 9,1
- 7,4
- 4,8
- 3,6
- 5,3
- 3,6
- 2,4
- 1,7
- 13,4
- 6,0
- 3,8
- 2,1
- 0,5
- 4,2
- 1,4
- 0,7
- 0.2
- 19,8
- 9,6
- 4,4
- 1,5
- 1,2
- 0,9
- 100,0
Source: Cedigaz

-
 Gas Natural