
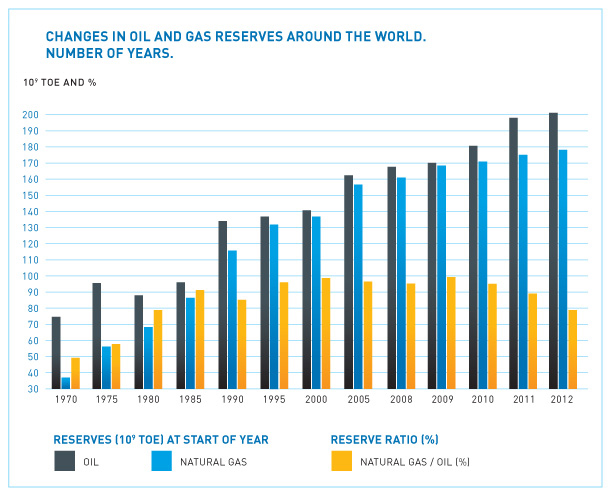
The reserves have grown 60% since 1990, the consumption being 65.2% higher with regard to the same referenced year. North America is the region in the world that has seen its natural gas proved reserves rise the most.
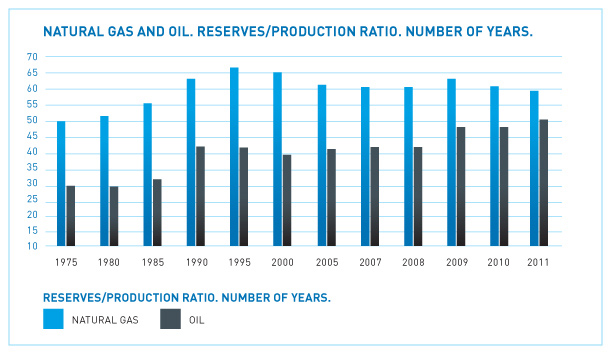
The availability of natural gas proved reserves is stabilized for around 60 years, in order to meet current consumption.
WORLD'S PROVED NATURAL GAS RESERVES
- North America
- Central & South America
- Europe (2)
- CIS
- Africa
- Middle East
- Asia - Pacific
- TOTAL
- 9,5
- 2,0
- 3,9
- 11,3
- 3,8
- 6,6
- 1,6
- 39,4
- 8,5
- 2,4
- 4,1
- 24,2
- 5,2
- 15,3
- 3,4
- 63,1
- 8,0
- 4,4
- 4,4
- 29,1
- 5,6
- 18,5
- 4,6
- 74,6
- 8,4
- 5,4
- 5,7
- 38,0
- 5,9
- 25,9
- 7,0
- 96,3
- 7,7
- 6,9
- 5,7
- 48,9
- 8,5
- 37,8
- 8,6
- 124,1
- 6,5
- 7,8
- 6,2
- 58,9
- 9,9
- 44,7
- 13,1
- 147,1
- 6,5
- 7,7
- 8,1
- 52,7
- 11,4
- 54,7
- 11,9
- 153,1
- 7.0
- 7,4
- 6,5
- 53,7
- 14,1
- 72,5
- 13,9
- 175,1
- 9,4
- 7,8
- 5,8
- 60,5
- 14,7
- 75,5
- 16,2
- 189,9
- 9,9
- 7,9
- 5,5
- 62,0
- 14,5
- 79,0
- 16,5
- 195,3
- 10,8
- 8,1
- 5,4
- 61,9
- 14,3
- 82,3
- 15,5
- 198,3
(2) Since 2000, EU 27 plus Norway, Switzerland, Central Europe and Turkey. Figures for previous
Source: Cedigaz y Oil and Gas Journal. Prepared by Sedigas.
The greatest concentrations of gas are found in the Middle East (41% of the worldwide total), followed by the group of CIS countries (31%). The European reserves still have a tendency to drop, representing only 2.7% of the natural gas proved reserves.
The Russian Federation occupies the top spot in this ranking, with some 46,000 bcm of proved reserves. Iraq follows (almost 37,000 bcm), Qatar (25,000 bcm) and then Saudi Arabia. Turkmenistan sits in fifth position, followed by the US, Venezuela and Abu Dhabi.
Among the newest findings, we can highlight as examples those found by Petrobas and Repsol in the deep waters of Brazil and Eni’s discovery opposite the Mozambique coast, 1,600 meters below sea level.
- North America
- USA
- Canada
- South & Central America
- Venezuela
- Bolivia
- Argentina
- Trinidad & Tobago
- Mexico
- Brazil
- Peru
- Western Europe
- Norway
- Netherlands
- United Kingdom
- Germany
- Italy
- Eastern Europe and CIS
- Russia
- Turkmenistan
- Kazakhstan
- Uzbekistan
- Azerbaijan
- Ukraine
- Romania
- Africa
- Nigeria
- Algeria
- Egypt
- Libya
- Angola
- Middle East
- Irán
- Qatar
- Saudi Arabia
- Abu Dhabi
- Iraq
- Kuwait
- Oman
- Yemen
- Asia - Pacific
- China
- Indonesia
- Australia
- Malaysia
- India
- Pakistan
- Papua-New Guinea
- Bangladesh
- Brunei
- WORLD TOTAL
- 7.044
- 5.451
- 1.593
- 7.378
- 4.287
- 757
- 542
- 532
- 419
- 326
- 338
- 6.462
- 3.159
- 1.449
- 826
- 191
- 125
- 295
- 53.744
- 44.840
- 2.680
- 1.900
- 1.745
- 1.275
- 1.040
- 14.078
- 5.117
- 4.545
- 1.869
- 1.491
- 270
- 72.514
- 27.500
- 25.783
- 6.834
- 5.630
- 3.170
- 1.572
- 690
- 479
- 13.886
- 2.020
- 2.650
- 2.650
- 2.272
- 923
- 798
- 428
- 422
- 345
- 175.106
- 8.364
- 6.730
- 1.634
- 7.721
- 4.838
- 710
- 442
- 479
- 373
- 365
- 335
- 6.092
- 2.961
- 1.266
- 647
- 137
- 84
- 628
- 53.863
- 44.900
- 2.680
- 1.950
- 1.755
- 1.285
- 1.030
- 14.511
- 5.292
- 4.504
- 2.060
- 1.495
- 275
- 73.579
- 28.080
- 25.636
- 7.300
- 5.680
- 3.170
- 1.784
- 630
- 488
- 14.973
- 2.600
- 3.184
- 2.362
- 2.347
- 1.055
- 850
- 435
- 374
- 321
- 179.103
- 9.439
- 7.712
- 1.727
- 7.790
- 5.062
- 695
- 379
- 408
- 339
- 358
- 340
- 5.756
- 2.819
- 1.247
- 564
- 98
- 64
- 606
- 60.533
- 46.000
- 8.340
- 1.950
- 1.682
- 1.310
- 990
- 14.735
- 5.292
- 4.504
- 2.185
- 1.549
- 310
- 75.489
- 29.610
- 25.366
- 7.920
- 5.715
- 3.170
- 1.784
- 610
- 490
- 16.201
- 2.751
- 3.068
- 3.591
- 2.362
- 1.085
- 818
- 442
- 364
- 309
- 189.943
- 9.900
- 8.200
- 1.700
- 7.900
- 5.521
- 281
- 379
- 381
- 349
- 417
- 353
- 5.534
- 2.762
- 1.161
- 520
- 87
- 66
- 595
- 61.975
- 46.000
- 10.000
- 1.913
- 1.661
- 1.317
- 969
- 14.541
- 5.110
- 4.504
- 2.210
- 1.495
- 310
- 78.999
- 33.090
- 25.210
- 8.016
- 5.715
- 3.158
- 1.784
- 610
- 488
- 16.459
- 2.853
- 3.068
- 3.701
- 2.328
- 1.085
- 810
- 442
- 366
- 301
- 195.308
- 10.808
- 9.134
- 1.674
- 8.093
- 6.022
- 105
- 379
- 356
- 505
- 475
- 361
- 5.362
- 2.719
- 1.090
- 514
- 87
- 69
- 595
- 61.905
- 46.000
- 10.000
- 1.913
- 1.661
- 1.317
- 969
- 14.308
- 4.934
- 4.504
- 2.210
- 1.443
- 310
- 82.340
- 36.961
- 25.038
- 8.243
- 5.392
- 3.146
- 1.784
- 610
- 488
- 15.455
- 2.853
- 4.083
- 937
- 2.328
- 1.166
- 727
- 1166
- 344
- 301
- 198.271
- 9,2
- 11,4
- -1,5
- 2,4
- 9,1
- -62,6
- 0,0
- -6,6
- 44,7
- 13,9
- 2,3
- -3,1
- -1,6
- -6,1
- -1,2
- 0,0
- 4,5
- 0,0
- -0,1
- 0,0
- 0,0
- 0,0
- 0,0
- 0,0
- 0,0
- -1,6
- -3,4
- 0,0
- 0,0
- -3,5
- 0,0
- 4,2
- 11,7
- -0,7
- 2,8
- -5,7
- -0,4
- 0,0
- 0,0
- 0,0
- -6,1
- 0,0
- 33,1
- -74,7
- 0,0
- 7,5
- -10,2
- 163,8
- -6,0
- 0,0
- 1,5
- 5,5
- 4,6
- 0,8
- 4,1
- 3,0
- 0,1
- 0,2
- 0,2
- 0,3
- 0,2
- 0,2
- 2,7
- 1,4
- 0,5
- 0,3
- 0,0
- 0,0
- 0,3
- 31,2
- 23,2
- 5,0
- 1,0
- 0,8
- 0,7
- 0,5
- 7,2
- 2,5
- 2,3
- 1,1
- 0,7
- 0,2
- 41,5
- 18,6
- 12,6
- 4,2
- 2,7
- 1,6
- 0,9
- 0,3
- 0,2
- 7,8
- 1,4
- 2,1
- 0,5
- 1,2
- 0,6
- 0,4
- 0,6
- 0,2
- 0,2
- 100
Source: Cedigaz and Oil and Gas Journal. Prepared by Sedigas.
The EIA estimates that the natural gas reserves will be sufficient enough to face current world consumption for around another 200 years.
Research regarding the search for unconventional gas has generated great prospects. The US Government Agency. The Energy Information Administration (EIA) published a report in the beginning of April on shale gas resources that are technically recoverable in 32 world countries (not including the US) contained in 72 geological formations. The EIA’s initial or provisional estimate notes the figure at 5,760 tcf of gas, equal to 163 billion (1012) m3 of gas. The figure that the EIA shows in the US is 24 billion cubic meters of natural gas. These resources will add 40% to the figures that are being controlled by different sources of the proved gas reserves, those of which there is usually only one part of unconventional gas.
In reference to reserves, it is known that Canada has a potential for unconventional gas, in Arctic Canada. Unconventional gas resources are being evaluated lately, as in many other countries. A study carried out in March by the consulting agency Energy Futures Network concludes that Canada has between 37.9 tcm (37,900 bcm) and 39.9 tcm of recoverable unconventional gas resources, mainly shale gas. These figures are 50% higher than those in another study carried out one year before.