

Initial official 2011 data indicates that total energy consumption reached 130.2 million tonnes of oil equivalent (toe), similar to amounts recorded in previous years.
- Coal
- Oil
- Natural gas
- Nuclear
- Renewable Energy
- -Hydraulic
- -Wind
- -Biomass and waste
- -Biofuels
- -Geothermal
- -Solar
- Elect. Balance (Im-Ex)
- TOTAL
- 13.983
- 68.182
- 34.782
- 15.368
- 10.942
- 2.004
- 2.795
- 5.162
- 620
- 8
- 353
- -949
- 142.308
- 9,8
- 47,9
- 24,4
- 10,8
- 7,7
- 1,4
- 2,0
- 3,6
- 0,4
- 0,0
- 0,2
- -0,7
- 100,0
- 10.353
- 63.673
- 31.104
- 13.750
- 12.325
- 2.257
- 3.196
- 5.087
- 1.058
- 9
- 718
- -697
- 130.508
- 7,9
- 48,8
- 23,8
- 10,5
- 9,4
- 1,7
- 2,4
- 3,9
- 0,8
- 0,0
- 0,6
- -0,5
- 100,0
- 7.156
- 60.993
- 31.182
- 16.155
- 15.263
- 3.636
- 3.798
- 5.380
- 1.413
- 16
- 1020
- -717
- 130.032
- 5,5
- 46,9
- 24,0
- 12,4
- 11,7
- 2,8
- 2,9
- 4,1
- 1,1
- 0,0
- 0,8
- -0,6
- 100,0
- 13.045
- 58.957
- 28.992
- 15.029
- 14.727
- 3.625
- 3.617
- 5.235
- 1.579
- 21
- 1650
- -525
- 130.225
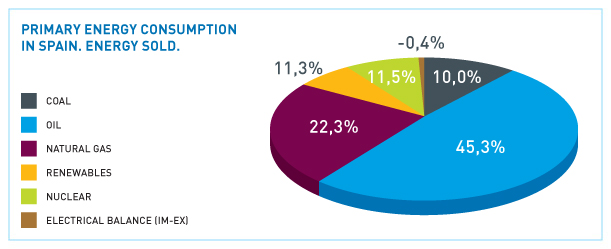
- 10,0
- 45,3
- 22,3
- 11,5
- 11,3
- 2,0
- 2,8
- 4,0
- 1,2
- 0,0
- 1,3
- -0,4
- 100,0
(2) Provisional data at 1/02/2012
Source: Secretaría de Estado de la Energía. Ministerio de Industria, Energía y Turismo.
The most significant features regarding the behaviour of each energy type in 2011 were:
- The increase of coal consumption (+82%); mainly the increase of imported coal.
- The decrease (-3.3%) in oil consumption and, therefore, in petroleum products, as a result of falls in almost all of their end uses.
- A fall of 7% in natural gas consumption, due mainly to a decrease in demand of cycles and the mild winter temperatures experienced.
- A drop in nuclear generation (-7%) as a result of increased technical stoppages.
- A drop in the production of overall renewable energy (-3.5%). Hydropower, wind, biomass and waste production all recorded losses. Geothermal energy and particularly solar energy are estimated to have risen by 62% according to MINETUR (the Spanish Ministry of Industry, Energy and Tourism).
Over 2011, several studies focused on a future energy mix: the 2011–2020 Indicative Energy Plan, the Saving and Energy Efficiency Action Plan, the Renewable Energy Plan (PER), the draft of the document for the 2012–2020 Gas and Electricity Sectors Plan.
- Coal
- Oil
- Natural gas
- Renewables
- Nuclear
- TOTAL
- -7,2
- 2,5
- 13,3
- 63,2
- -1,8
- 3,0
- 4,5
- 2,5
- 16,0
- -10,0
- 2,8
- 4,4
- 2,3
- 1,1
- 17,6
- -14,6
- -9,5
- 2,7
- -5,0
- -1,4
- 4,1
- 19,8
- 4,5
- -0,9
- 10,2
- 0,1
- 4,3
- 13,2
- -8,4
- 1,7
- -29,2
- -3,8
- 10,1
- 5,0
- 7,0
- -3,6
- -26,0
- -6,6
- -10,5
- 12,6,0
- -10,5
- -8,3
- -30,9
- -4,2
- -0,3
- 23,8
- -17,5
- -0,4
- 82,3
- -3,3
- -7,0
- -3,5
- -7,0
- 0,1
- Coal
- Oil
- Natural gas
- Renewables
- Nuclear
- Electrical Balance (Im-Ex)
- TOTAL
- 21,6
- 54,2
- 5,7
- 2,5
- 16,1
- 0,0
- 100,0
- 19,2
- 55,9
- 7,7
- 2,0
- 14,8
- 0,4
- 100,0
- 18,4
- 53,1
- 12,5
- 2,4
- 13,3
- 0,3
- 100,0
- 15,9
- 50,6
- 20,5
- 2,5
- 10,6
- -0,1
- 100,0
- 9,8
- 47,9
- 24,4
- 7,7
- 10,8
- -0,7
- 100,0
- 7,9
- 48,8
- 23,8
- 9,4
- 10,5
- -0,5
- 100,0
- 7,9
- 49,4
- 24,6
- 6,5
- 12,2
- -0,6
- 100,0
- 10,0
- 45,3
- 22,3
- 11,3
- 11,5
- -0,4
- 100,0
- Coal
- Oil
- Natural Gas
- TOTAL (3)
- 67,5
- 5,5
- 13,0
- 35,9
- 60,7
- 1,7
- 24,6
- 34,0
- 53,1
- 1,2
- 7,2
- 28,2
- 39,6
- 0,3
- 1,0
- 23,3
- 35,3
- 0,2
- 0,5
- 18,9
- 33,7
- 0,2
- 0,0
- 18,7
- 37,9
- 0,2
- 0,0
- 19,1
- 46,2
- 0,2
- 0,0
- 20,2
- 42,4
- 0,2
- 0,2
- 26,6
- 17,0
- 0,2
- 0,2
- 24,7
(2) Provisional data at 1/2/2012
(3) Out of the Total, including nuclear, hydraulic and other renewable energy sources, with 100% Spanish supply allocation.
Source: Secretaría de Estado de Energía. Ministerio de Industria, Energía y Turismo.
- Coal
- Oil
- Natural gas
- Nuclear
- Renewable Energy
- TOTAL
- 5.865
- 143
- 16
- 14.360
- 9.966
- 30.350
- 19,3
- 0,5
- 0,1
- 47,3
- 32,8
- 100,0
- 4.374
- 127
- 14
- 15.368
- 10.942
- 30.825
- 14,2
- 0,4
- 0,0
- 49.9
- 35,5
- 100,0
- 3.778
- 107
- 12
- 13.750
- 12.326
- 29.973
- 12,6
- 0,4
- 0,0
- 45,9
- 41,1
- 100,0
- 3.033
- 125
- 51
- 16.155
- 15.263
- 34.627
- 8,8
- 0,4
- 0,1
- 46,7
- 44,1
- 100,0
- 2.221
- 102
- 49
- 15.029
- 14.727
- 32.128
- 6,9
- 0,3
- 0,2
- 46,8
- 45,8
- 100,0
Source: Secretaría de Estado de Energía. Ministerio de Industria, Energía y Turismo.
The Saving and Energy Efficiency Action Plan was sent to Brussels in July 2011, in accordance with Directive 2006/32/EC2 of the European Parliament and the Council, of 5 April 2006.
Primary and end-use energy savings suggested in this document are consistent with the scenarios of primary and end-use energy consumption incorporated in the Indicative Energy Plan outlined in Article 79 of the Sustainable Economy Act 2/2011 and in other planning instruments concerning renewable energy.
Renewable energy fell slightly as regards its market share among primary energy sources to 11.3%.
In keeping with the aforementioned increase in coal consumption as a primary energy source, this energy share grew to 10% in 2011.
Oil is slowly but surely developing a slight downward trend as regards the share (45% in 2011) it represents within the Spanish energy mix, already under 50% over the past few years.
- OF FINAL ENERGY
- 3.461
- 3.550
- 3.716
- 3.398
- 1.924
- 3.064
- 3.360
- 2.8314

-
 Gas Natural