

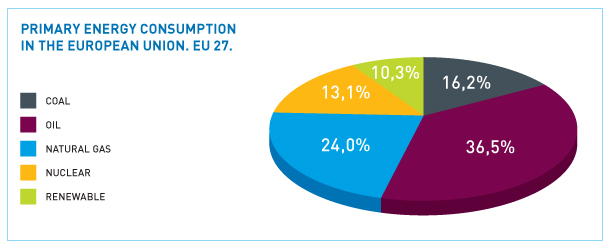
Oil continues to yield market share in global energy consumption, even though figures are increasing in absolute values. Approximately one third of global consumption of primary energy is from petroleum products. Coal is in second position with a share of over 30%. Natural gas has also increased in magnitude and percentage: it provides approximately 24% of global energy needs.
According to BP data (Statistical Review of World Energy), hydrocarbons currently satisfy 87% of the world’s energy needs. This share will drop in the medium and long term, but on the 2035 horizon, they will still provide close to 80% of the global energy demand.
Forecasts indicate that in 2035 renewable energies will provide more than 14% of global energy needs. Currently this share is 10%.
- Coal
- Oil
- Natural gas
- Nuclear (3)
- Hydroelec.(4)
- Others Renovables
- WORLD TOTAL
- OECD
- 2.399,7
- 3.571,6
- 2.176,2
- 584,3
- 599,4
- 51,2
- 9.382,4
- 5.435,4
- 25,6
- 38,1
- 23,2
- 6,2
- 6,4
- 0,5
- 100,0
- 57,9
- 3.012,9
- 3.908,5
- 2.511,2
- 626,8
- 658,6
- 83,1
- 10.801,1
- 5.667,3
- 27,9
- 36,2
- 23,2
- 5,8
- 6,1
- 0,8
- 100,0
- 52,5
- 3.305,6
- 3.908,7
- 2.661,4
- 614,0
- 736,3
- 137,4
- 11.363,4
- 5.378,4
- 29,1
- 34,4
- 23,4
- 5,4
- 6,5
- 1,2
- 100,0
- 47,3
- 3.555,8
- 4.028,1
- 2.858,1
- 626,2
- 775,6
- 158,6
- 12.002,4
- 5.568,3
- 29,6
- 33,6
- 23,8
- 5,2
- 6,5
- 1,3
- 100,0
- 46,4
- 3.734
- 3.988
- 2.955
- 610
- 814
- 174
- 12.275,5
- 5.295
- 30,4
- 32,5
- 24,1
- 5,0
- 6,6
- 1,4
- 100,0
- 45,9
Source: BP Statistical Review of World Energy. June 2011; Monthly Natural Gas Survey (AIE), Oil and Gas Journal and prepared by Sedigas.
The Russian Federation (691 million, 5.8%), India (524 million), Japan (501 million), Canada, Brazil, France, Germany and Iran are at the next positions in the list.
- North America
- USA
- Canada
- Central and Sur America
- Argentina
- Brazil
- Mexico
- Venezuela
- Chile
- Colombia
- Europe
- Germany
- Austria
- Belgium and Luxembourg
- Bulgaria
- Denmark
- Spain
- Finland
- France
- Greece
- Ireland
- Italy
- Netherlands
- Poland
- Portugal
- United Kingdom
- Czech Republic
- Romania
- Sweden
- CIS
- Russian Fed.
- Ukraine
- Middle East
- Iran
- Saudi Arabia
- Kuwait
- UAE
- Africa
- South Africa
- Egypt
- Algeria
- Asia-Oceania
- Australia
- South Korea
- China
- India
- Japan
- Indonesia
- TOTAL WORLD
- OCDE
- 36,6
- 37,2
- 32,3
- 47,3
- 33,3
- 46,0
- 51,7
- 43,9
- 51,9
- 34,1
- 37,1
- 6,9
- 39,0
- 50,1
- 23,2
- 44,6
- 47,3
- 35,7
- 33,1
- 56,7
- 52,1
- 42,5
- 49,8
- 27,4
- 46,5
- 35,2
- 22,3
- 26,3
- 28,7
- 20,4
- 21,4
- 9,8
- 51,4
- 40,5
- 62,4
- 57,8
- 37,2
- 41,7
- 20,9
- 44,8
- 36,2
- 27,7
- 36,0
- 41,4
- 17,6
- 29,7
- 40,2
- 42,6
- 33,6
- 38,0
- 27,1
- 27,2
- 26,7
- 25,0
- 50,6
- 9,4
- 36,7
- 34,4
- 14,8
- 25,4
- 25,5
- 33,3
- 27,3
- 24,9
- 12,7
- 23,1
- 23,5
- 12,0
- 16,7
- 10,1
- 32,9
- 39,8
- 39,2
- 13,5
- 16,6
- 40,4
- 20,3
- 34,7
- 2,8
- 50,1
- 54,0
- 39,7
- 46,9
- 57,9
- 37,6
- 42,2
- 62,8
- 25,4
- 2,8
- 50,1
- 63,1
- 11,2
- 23,1
- 15,1
- 4,0
- 10,6
- 17,0
- 25,9
- 23,8
- 25,1
- 21,1
- 23,0
- 7,4
- 4,1
- 1,6
- 4,9
- 5,0
- 0,0
- 13,1
- 11,8
- 16,0
- 34,9
- 6,0
- 7,0
- 36,5
- 19,5
- 6,3
- 15,8
- 4,8
- 26,1
- 9,6
- 8,0
- 7,9
- 56,3
- 12,5
- 14,9
- 38,7
- 17,9
- 4,0
- 17,0
- 13,6
- 30,8
- 1,3
- 0,5
- 0,0
- 0,0
- 0,0
- 25,6
- 73,4
- 0,9
- 0,7
- 52,1
- 36,7
- 29,8
- 70,5
- 53,0
- 24,7
- 28,1
- 29,6
- 19,8
- 8,2
- 8,4
- 6,4
- 0,8
- 2,1
- 1,3
- 0,8
- 0,0
- 0,0
- 0,0
- 11,2
- 14,5
- 0,0
- 15,6
- 19,3
- 0,0
- 12,2
- 17,9
- 38,4
- 0,0
- 0,0
- 0,0
- 0,9
- 0,0
- 0,0
- 6,7
- 15,3
- 7,5
- 26,1
- 5,6
- 5,6
- 17,1
- 0,0
- 0,0
- 0,0
- 0,0
- 0,0
- 0,8
- 2,6
- 0,0
- 0,0
- 2,9
- 0,0
- 13,1
- 0,7
- 1,0
- 13,2
- 0,0
- 5,2
- 9,4
- 5,4
- 2,6
- 26,2
- 21,2
- 11,9
- 35,3
- 4,9
- 21,7
- 17,3
- 28,2
- 6,8
- 2,0
- 23,4
- 0,1
- 7,2
- 0,0
- 6,0
- 11,0
- 5,7
- 5,2
- 0,7
- 6,5
- 0,0
- 0,8
- 14,0
- 0,4
- 1,9
- 13,3
- 29,9
- 6,3
- 5,5
- 2,5
- 0,4
- 1,0
- 0,0
- 0,0
- 0,0
- 6,2
- 0,2
- 3,9
- 0,0
- 5,4
- 2,9
- 0,3
- 6,7
- 4,8
- 3,9
- 1,9
- 6,5
- 5,6
- 1,6
- 1,7
- 1,0
- 1,6
- 0,5
- 3,1
- 1,0
- 0,0
- 2,8
- 0,6
- 3,4
- 8,5
- 4,2
- 2,1
- 1,1
- 12,8
- 4,7
- 7,6
- 1,3
- 1,8
- 4,8
- 3,3
- 2,2
- 2,0
- 10,3
- 2,3
- 1,5
- 0,3
- 8,5
- 0,6
- 0,0
- 0,0
- 0,0
- 0,0
- 0,0
- 0,0
- 0,0
- 0,3
- 0,1
- 0,4
- 0,0
- 0,7
- 1,3
- 0,2
- 0,5
- 1,0
- 1,0
- 1,5
- 1,3
- 2,2
- 100,0
- 100,0
- 100,0
- 100,0
- 100,0
- 100,0
- 100,0
- 100,0
- 100,0
- 100,0
- 100,0
- 100,0
- 100,0
- 100,0
- 100,0
- 100,0
- 100,0
- 100,0
- 100,0
- 100,0
- 100,0
- 100,0
- 100,0
- 100,0
- 100,0
- 100,0
- 100,0
- 100,0
- 100,0
- 100,0
- 100,0
- 100,0
- 100,0
- 100,0
- 100,0
- 100,0
- 100,0
- 100,0
- 100,0
- 100,0
- 100,0
- 100,0
- 100,0
- 100,0
- 100,0
- 100,0
- 100,0
- 100,0
- 100,0
- 100,0
- 2.602,4
- 2.285,7
- 316,7
- 781,0
- 77,1
- 253,9
- 169,1
- 80,2
- 28,3
- 32,3
- 1.891,5
- 219,5
- 33,3
- 69,8
- 18,1
- 19,5
- 132,0
- 29,1
- 252,3
- 32,6
- 14,6
- 172,1
- 100,0
- 95,9
- 27,1
- 209,2
- 41,3
- 34,6
- 50,5
- 1.080,0
- 690,8
- 118,0
- 701,1
- 212,6
- 201,0
- 30,6
- 86,8
- 372,7
- 120,9
- 81,1
- 41,2
- 4.573,9
- 118,2
- 254,9
- 2.432,1
- 524,2
- 501,0
- 140,0
- 12.002,4
- 5.568,4
The initial impressions about energy consumption in the EU in 2011 pointed to stagnation. Industrial indicators with increases of less than 0.5% and a decrease in the demand for heating marked the year.
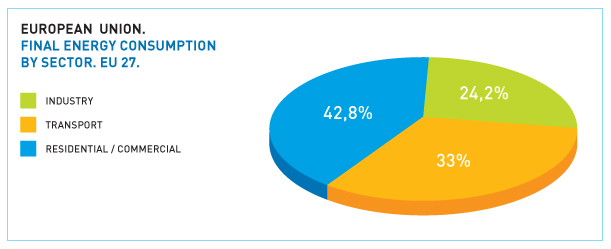
The available data on end-use energy consumption in the EU indicate that the residential-commercial market continues to be the main destination of the energy supply side, at approximately 42%. It is followed by transport (33%) and finally industry, at 24.2%. This latter sector continues to lose weight relative to the end consumer of energy in Europe, at the average pace of approximately 1 percentage point per year.
This energy demand is satisfied first with nuclear energy, then with coal and finally with natural gas.
- Coal
- Oil
- Natural gas
- Nuclear
- Renewable
- TOTAL
- 328,6
- 658,9
- 432,5
- 241,4
- 134,5
- 1.795,9
- 18,3
- 36,7
- 24,1
- 13,4
- 7,5
- 100,0
- 305,4
- 658,5
- 440,7
- 241,9
- 144,2
- 1.790,7
- 17,1
- 36,8
- 24,6
- 13,5
- 8,1
- 100,0
- 267,9
- 622,9
- 416,7
- 230,8
- 152,6
- 1.690,9
- 15,8
- 36,8
- 24,6
- 13,6
- 9,0
- 100,0
- 265
- 634
- 442
- 225
- 165
- 1.731,7
- 15,3
- 36,6
- 25,5
- 13,0
- 9,5
- 100,0
- 278
- 628
- 395
- 225
- 177
- 1.702,1
- 16,3
- 36,9
- 23,2
- 13,2
- 10,4
- 100,0
Source: Energy Yearly Statistics 2009 and Statistics in Focus. Eurostat. European Commission. Prepared by Sedigas.
Wind energy continues to position itself as the renewable energy with the most installed power. At the end of June 2011, global installed capacity amounted to 215,000 MW, an increase of 22.9% with respect to 2010.
Close to 50% of the new wind energy capacity that was installed in the world in 2011 is located in China.
Photovoltaic energy continues with the expansion of recent years, partly a consequence of a notable reduction in costs due to technological advances and due to economies of scale. China is also playing a prominent role here, doubling its installed in power in recent years.

- Industry
- Transport
- Residential-Commerc.
- TOTAL
- 332,3
- 364,7
- 485,4
- 1.182,4
- 28,1
- 30,8
- 41,1
- 100,0
- 328,3
- 372,2
- 485,6
- 1.186,1
- 27,7
- 31,4
- 40,9
- 100,0
- 330,6
- 376,8
- 457,4
- 1.164,8
- 28,4
- 32,3
- 39,3
- 100,0
- 315,9
- 377,9
- 481,5
- 1.168,7
- 26,9
- 32,2
- 41,0
- 100,0
- 269,5
- 367,6
- 476,6
- 1.113,7
- 24,2
- 33,0
- 42,8
- 100,0

-
 Enagás
 -
 Endesa