

In the first quarter of 2010, estimated sales rose to an amount of 112 TWh. This figure represents a 6.4% increase when compared to the same period in 2009. This increase is more specifically related to the so-called conventional market, that is the domestic, commercial and industrial markets. Electricity generation in plants (combined cycles) recorded a 6.1% decrease. Demand on the conventional market increased by 12.1%.

This increase in sales slipped in the second quarter, with a 4% decrease in total demand during this period. The result was that demand in the first quarter modestly increased by 1.5%.
This market situation continued into the third quarter, at which point natural gas sales fell 8.4%. As a result, sales for the first 9 months of 2010 fell by 1.6%.
In the fourth quarter, less pressure was applied to combined cycle electrical production due to the reduced expansion of renewable energy and the increase of electrical consumption. During this period, demand for natural gas at power plants decreased by 12.5% when compared to the 2009 fourth quarter, while during the second and third quarter, decreases exceeded 20% in both cases.
The result was that total demand for natural gas during the fourth quarter recorded a positive balance of 3.7%.
- MARKET
- 1. RESIDENTIAL-COMMERCIAL
- Natural gas
- Gas manufactured from NG
- 1.1 Subtotal natural gas
- Propane-air mix
- 1.2. Subtotal other gases
- 2. INDUSTRIAL
- 3. ELECTRICITY PLANTS
- 4. NON-ENERGY USE
- 5. TOTAL NATURAL GAS (1.1+2+3+4)
- TOTAL (1.2+5)
- TOTAL Sales of natural gas (bcm)
- 34.755
- 34.221
- 31
- 34.253
- 502
- 502
- 144.994
- 10.379
- 6.131
- 195.756
- 196.258
- 16,8
- 56.425
- 55.856
- 0
- 55.856
- 568
- 568
- 202.278
- 111.320
- 6.199
- 375.653
- 376.221
- 32,3
- 56.785
- 56.231
- 0
- 56.231
- 554
- 554
- 203.391
- 142.057
- 6.158
- 407.837
- 408.391
- 35,1
- 59.617
- 59.044
- 0
- 59.044
- 573
- 573
- 197.256
- 187.534
- 5.033
- 448.868
- 449.441
- 38,6
- 55.945
- 55.497
- 0
- 55.497
- 448
- 448
- 180.264
- 160.888
- 4.874
- 401.523
- 401.971
- 34,5
- 64.328
- 64.279
- 0
- 64.279
- 49
- 49
- 194.089
- 135.625
- 6.131
- 400.125
- 400.174
- 34,4
- MARKET
- RESIDENTIAL-COMMERCIAL
- INDUSTRIAL
- ELECTRICITY PLANTS (1)
- NON-ENERGY USES
- TOTAL
- 16,1
- 57,6
- 25,6
- 0,6
- 100,0
- 16,6
- 71,9
- 3,7
- 7,9
- 100,0
- 18,9
- 73,6
- 0,9
- 6,6
- 100,0
- 17,5
- 74,1
- 5,3
- 3,1
- 100,0
- 13,2
- 50,9
- 34,4
- 1,5
- 100,0
- 13,8
- 49,9
- 34,8
- 1,5
- 100,0
- 13,2
- 43,9
- 41,8
- 1,1
- 100,0
- 13,8
- 44,9
- 40,1
- 1,2
- 100,0
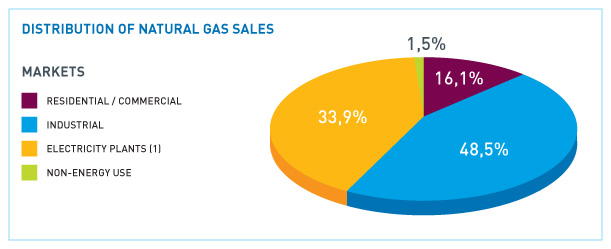
- 16,1
- 48,5
- 33,9
- 1,5
- 100,0
- MARKET
- 1. RESIDENTIAL-COMMERCIAL
- Natural gas
- Gas manufactured from NG
- 1.1 Subtotal natural gas
- Propane-air mix
- 1.2. Subtotal other gases
- 2. INDUSTRIAL
- 3. ELECTRICITY PLANTS
- 4. NON-ENERGY USES
- 5. TOTAL NATURAL GAS (1.1+2+3+4)
- TOTAL (1.2+5)
- 16,7
- 17,4
- -94,4
- 17,3
- -24,3
- -24,3
- 5,5
- 22,7
- -0,7
- 8,3
- 8,2
- 7,0
- 6,6
- -100,0
- 6,6
- 41,1
- 41,1
- 9,2
- 115,0
- -5,5
- 14,7
- 14,7
- 10,1
- 10,4
- --
- 10,4
- -15,3
- -15,3
- 9,0
- 46,3
- 5,8
- 13,3
- 13,3
- 8,9
- 8,8
- --
- 8,8
- 9,8
- 9,8
- 7,8
- 65,0
- -6,6
- 16,0
- 16,0
- 8,5
- 8,5
- --
- 8,5
- 13,7
- 13,7
- 3,1
- 68,4
- 9,0
- 17,6
- 17,6
- -7,9
- -7,8
- --
- -7,8
- -11,8
- -11,8
- -1,5
- 21,0
- -8,1
- 4,1
- 4,1
- 9,2
- 9,2
- --
- 9,2
- 10,6
- 10,6
- 2,1
- 5,5
- 8,1
- 4,3
- 4,3
- 5,0
- 5,0
- ----
- 5,0
- 3,4
- 3,4
- -3,0
- 32,0
- -18,3
- 10,1
- 10,1
- -6,2
- -6,0
- ----
- -6,0
- -21,8
- -21,8
- -8,6
- -14,2
- -3,2
- -10,5
- -10,6
- 15,0
- 15,8
- ----
- 15,8
- -89,1
- -89,1
- 7,7
- -15,7
- 25,8
- -0,3
- -0,4