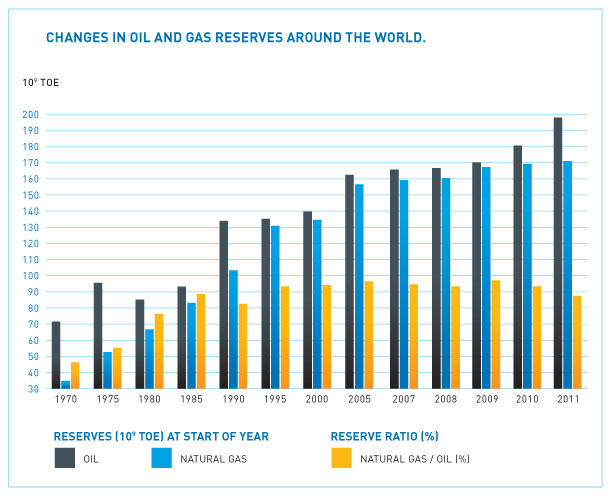
Data published by Oil and Gas Journal in late 2010 reveal a 0.6% yearly rise in proved natural gas reserves around the world, a figure consistent with historical values. If we apply this increase to the reserves Cedigaz estimated for the end of 2009, the result comes to 190.7 trillion (1012) m3, the highest figure in the history of this energy source.
WORLD'S PROVED NATURAL GAS RESERVES
- North America
- Central & South America
- OECD-Europe
- Eastern Europe and CIS
- Africa
- Middle East
- China and India
- TOTAL
- 9,4
- 1,9
- 3,6
- 12,5
- 3,8
- 6,6
- 1,6
- 39,4
- 8,5
- 2,4
- 4,1
- 24,2
- 5,2
- 15,3
- 3,4
- 63,1
- 8,0
- 4,4
- 3,9
- 31,6
- 5,7
- 18,5
- 4,8
- 76,9
- 8,4
- 5,4
- 5,7
- 38,0
- 5,9
- 25,9
- 7,0
- 96,3
- 7,5
- 6,9
- 5,5
- 52,5
- 8,5
- 37,8
- 10,6
- 129,3
- 6,5
- 7,8
- 6,2
- 58,9
- 9,9
- 44,7
- 13,1
- 147,1
- 6,5
- 7,7
- 8,1
- 52,7
- 11,4
- 54,7
- 11,9
- 153,1
- 7.0
- 7,4
- 6,5
- 53,7
- 14,1
- 72,5
- 13,9
- 175,1
- 8,7
- 7,8
- 6,0
- 59,6
- 14,7
- 75,2
- 15,7
- 187,7
- 9,4
- 8,0
- 5,8
- 60,5
- 14,7
- 75,5
- 15,7
- 189,6
- 9,4
- 8,0
- 5,3
- 60,5
- 15,4
- 76,3
- 15,7
- 190,7
Source: CEDIGAZ y Oil and Gas Journal. Elaboración propia
The AIE estimates that Europe’s conventional reserves equal 21 trillion (21,000 bcm), as opposed to the 6 trillion estimated by Cedigaz.
Europe notwithstanding, all regions have increased or maintained their reserve values. If we break it down into countries, the largest increases belong to Egypt (+32%), Angola (14%) and Peru, with a 3.5% rise.
- North America
- USA
- Canada
- South & Central America
- Venezuela
- Bolivia
- Argentina
- Trinidad & Tobago
- Mexico
- Brazil
- Peru
- Western Europe
- Norway
- Netherlands
- United Kingdom
- Germany
- Italy
- Eastern Europe and CIS
- Russia
- Turkmenistan
- Kazakhstan
- Uzbekistan
- Azerbaijan
- Ukraine
- Romania
- Africa
- Nigeria
- Algeria
- Egypt
- Libya
- Angola
- Middle East
- Irán
- Qatar
- Saudi Arabia
- Abu Dhabi
- Iraq
- Kuwait
- Oman
- Yemen
- China and India
- China
- Indonesia
- Australia
- Malaysia
- India
- Pakistan
- Papua-New Guinea
- Bangladesh
- Brunei
- WORLD TOTAL
- 7.044
- 5.451
- 1.593
- 7.378
- 4.287
- 757
- 542
- 532
- 419
- 326
- 338
- 6.462
- 3.159
- 1.449
- 826
- 191
- 125
- 295
- 53.744
- 44.840
- 2.680
- 1.900
- 1.745
- 1.275
- 1.040
- 14.078
- 5.117
- 4.545
- 1.869
- 1.491
- 270
- 72.514
- 27.500
- 25.783
- 6.834
- 5.630
- 3.170
- 1.572
- 690
- 479
- 13.886
- 2.020
- 2.650
- 2.650
- 2.272
- 923
- 798
- 428
- 422
- 345
- 175.106
- 8.364
- 6.730
- 1.634
- 7.721
- 4.838
- 710
- 442
- 479
- 373
- 365
- 335
- 6.092
- 2.961
- 1.266
- 647
- 137
- 84
- 628
- 53.863
- 44.900
- 2.680
- 1.950
- 1.755
- 1.285
- 1.030
- 14.511
- 5.292
- 4.504
- 2.060
- 1.495
- 275
- 73.579
- 28.080
- 25.636
- 7.300
- 5.680
- 3.170
- 1.784
- 630
- 488
- 14.973
- 2.600
- 3.184
- 2.362
- 2.347
- 1.055
- 850
- 435
- 374
- 321
- 179.103
- 8.679
- 6.925
- 1.754
- 7.791
- 4.982
- 710
- 399
- 435
- 359
- 365
- 345
- 5.983
- 2.985
- 1.222
- 601
- 126
- 69
- 617
- 59.626
- 44.900
- 8.400
- 1.950
- 1.745
- 1.359
- 1.010
- 14.707
- 5.292
- 4.504
- 2.170
- 1.540
- 310
- 75.199
- 29.610
- 25.466
- 7.570
- 5.705
- 3.170
- 1.784
- 610
- 490
- 15.704
- 2.700
- 3.038
- 3.145
- 2.346
- 1.074
- 843
- 442
- 344
- 321
- 187.689
- 9.397
- 7.712
- 1.685
- 7.969
- 5.241
- 695
- 379
- 408
- 339
- 358
- 345
- 5.756
- 2.819
- 1.247
- 564
- 98
- 64
- 606
- 60.533
- 46.000
- 8.340
- 1.950
- 1.682
- 1.310
- 990
- 14.736
- 5.292
- 4.504
- 2.185
- 1.549
- 310
- 75.489
- 29.610
- 25.366
- 7.920
- 5.715
- 3.170
- 1.784
- 610
- 490
- 15.727
- 2.751
- 2.960
- 3.225
- 2.362
- 1.085
- 818
- 442
- 364
- 309
- 189.607
- 9.397
- 7.712
- 1.685
- 8.018
- 5.327
- 695
- 360
- 382
- 319
- 360
- 357
- 5.324
- 2.485
- 1.222
- 494
- 98
- 58
- 606
- 60.533
- 46.000
- 8.340
- 1.950
- 1.682
- 1.310
- 990
- 15.404
- 5.338
- 4.504
- 2.883
- 1.558
- 353
- 76.287
- 29.610
- 25.267
- 8.287
- 6.104
- 3.170
- 1.784
- 610
- 490
- 15.696
- 2.571
- 2.960
- 3.225
- 2.362
- 1.084
- 818
- 442
- 364
- 309
- 190.659
- 0,0
- 0,0
- 0,0
- 0,6
- 1,6
- 0,0
- -5,0
- -6,4
- -5,9
- 0,6
- 3,5
- -7,5
- -11,8
- -2,0
- -12,4
- 0,0
- -9,4
- 0,0
- 0,0
- 0,0
- 0,0
- 0,0
- 0,0
- 0,0
- 0,0
- 4,5
- 0,9
- 0,0
- 31,9
- 0,6
- 13,9
- 1,1
- 0,0
- -0,4
- 4,6
- 6,8
- 0,0
- 0,0
- 0,0
- 0,0
- -0,2
- -6,5
- 0,0
- 0,0
- 0,0
- -0,1
- 0,0
- 0,0
- 0,0
- 0,0
- 0,6
- 4,9
- 4,0
- 0,9
- 4,2
- 2,8
- 0,4
- 0,2
- 0,2
- 0,2
- 0,2
- 0,2
- 2,8
- 1,3
- 0,6
- 0,3
- 0,1
- 0,0
- 0,3
- 31,7
- 24,1
- 4,4
- 1,0
- 0,9
- 0,7
- 0,5
- 8,1
- 2,8
- 2,4
- 1,5
- 0,8
- 0,2
- 40,0
- 15,5
- 13,3
- 4,3
- 3,2
- 1,7
- 0,9
- 0,3
- 0,3
- 8,2
- 1,3
- 1,6
- 1,7
- 1,2
- 0,6
- 0,4
- 0,2
- 0,2
- 0,2
- 100
Source: CEDIGAZ and Oil and Gas Journal. Prepared by Sedigas.

The greatest concentrations of gas may be found in the Middle East (40% of the worldwide total), followed by the collection of CIS countries (32%). European reserves continue to fall and now represent but 2.8% of the planet’s total.
The Russian Federation occupies the top spot in this ranking, with some 46,000 bcm of proved reserves. Next comes Iran (29,600 bcm), Qatar (25,000 bcm) and Saudi Arabia. Turkmenistan sits in fifth position, followed by the US, Abu Dhabi and Venezuela.
A study published by Oil and Gas Journal on 26 July estimates that North America’s natural gas reserves come to 101,000 bcm, 56% of which correspond to non-conventional gas. Of these, half are shale gas. In terms of non-conventional gas (some 56,000 bcm), 22,000 bcm are linked to Canada, while the rest (the majority) correspond to the US.
Poland is the European country that is currently investing the greatest amount of effort into localising non-conventional gas.
The excess supply and low prices are slowing down the drilling and mining of conventional gas, both in the US and Canada, a market, in the latter’s case, which revolves around exports, primarily to the US.
At the same time, conventional gas is being discovered in deep waters (the most notable example is Brazil, which could become a major exporter over the next decade) and shallow waters (see Repsol’s success in the Gulf of Venezuela and in Bolivia, for example).