

Oil products remain the most heavily consumed source of final energy in Spain, with a share of 52%. The demand dropped 1.7% last year. This contrasts with the 17.7% drop noted in 2009 with respect to the previous year.
The dieselization process maintains the same trend as in recent years. The persistent deficit of this product in Spain has encouraged adaptations and extensions in several refineries, the most important taking being the refinery in Cartagena.
Within the oil products segment, the provisional CORES figures suggest a 1% downturn in the demand for diesel. CORES (Official organization of strategic petroleum products reserves)positions the increase in the demand for kerosene (due to the increase of tourism) at 1.7%, with a 5% drop of the demand for LPG.
Second place is taken by electricity, with a share of 23.4%, and natural gas appears in third place with 17%.

Latest Eurostat data reveal that in the residential-commercial market, the electricity consumption per capita in Spain is 6.7% above the equivalent consumption in the EU. As regards natural gas, the consumption per capita in Spain stands at 34% of the average consumption per inhabitant in the EU (118 kgoe in Spain and 344 kgoe in the European Union).
FINAL ENERGY CONSUMPTION IN SPAIN(1)
- Coal
- Oil products
- Gas (3)
- Electricity
- E. Renovables
- TOTAL
- 2.546
- 55.628
- 12.292
- 16.306
- 3.473
- 90.245
- 2.424
- 61.738
- 17.628
- 20.836
- 3.805
- 106.431
- 2.265
- 60.919
- 16.430
- 21.540
- 4.003
- 101.154
- 2.317
- 61.928
- 17.755
- 22.171
- 3.681
- 107.852
- 2.080
- 59.595
- 17.258
- 22.253
- 4.432
- 105.618
- 1.453
- 49.032
- 14.806
- 21.008
- 4.746
- 91.045
- 1.650
- 48.198
- 15.783
- 21.659
- 5.372
- 92.662
(2) Provisional data as at 24/01/2011
(3) Natural and manufactured gas.
Source: Secretaría de Estado de la Energía. Ministerio de Industria, Turismo y Comercio.
- Coal
- Oil products
- Gas
- Electricity
- E. Renovables
- TOTAL
- 2,8
- 61,6
- 13,6
- 18,1
- 3,8
- 100,0
- 2,3
- 58,0
- 16,6
- 19,6
- 3,6
- 100,0
- 2,2
- 60,2
- 16,2
- 21,3
- 4,0
- 100,0
- 2,1
- 57,4
- 16,5
- 20,6
- 3,4
- 100,0
- 2,0
- 56,4
- 16,3
- 21,1
- 4,2
- 100,0
- 1,6
- 53,9
- 16,3
- 23,1
- 5,2
- 100,0
- 1,8
- 52,0
- 17,0
- 23,4
- 5,8
- 100,0
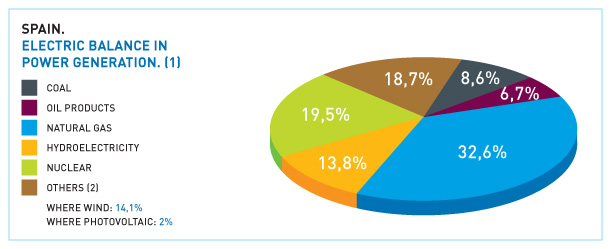
Total gross output of electricity amounted to 303 TWh, according to the first official Ministry of Industry, Tourism and Trade figures available when this report went to press. This figure represents an increase of 2.1% compared with the figure for 2009 and contrasts with the 6.6% downturn experienced in 2009.
The electricity demand closed with 260 TWh(source: REE), 3.2% above the figure for 2009. The electrical demand has broken several records in the first months of 2010. For instance, on January 11 a winter maximum was recorded (44,167 MW), and then topped during the following weeks. As regards the summer period, July, August and September were the hottest months since 1970. On July 19, a historical record for hourly power average was established at 41,318 MW.
- Coal
- Oil products
- Natural gas
- Hydroelectrity
- Nuclear
- Others (3)
- Where wind:
- Photovoltaic:
- TOTAL
- 66.981
- 15.474
- 6.087
- 24.241
- 55.445
- 1.288
- n.d.
- n.d.
- 169.516
- 39,5
- 9,1
- 3,6
- 14,3
- 32,7
- 0,8
- --
- --
- 100
- 81.993
- 23.211
- 82.458
- 23.025
- 57.539
- 26.230
- 21.269
- n.d.
- 294.456
- 27,8
- 7,9
- 28,0
- 7,8
- 19,5
- 8,9
- 7,2
- --
- 100
- 50.482
- 20.062
- 123.481
- 26.117
- 58.971
- 38.749
- 32.496
- 2.557
- 317.862
- 15,6
- 6,3
- 38,8
- 8,2
- 18,6
- 12,2
- 10,2
- 0,8
- 100
- 36.894
- 20.045
- 110.850
- 26.252
- 52.761
- 50.044
- 37.164
- 6.077
- 296.846
- 12,4
- 6,8
- 37,3
- 8,8
- 17,8
- 16,9
- 12,5
- 2,0
- 100
- 26.214
- 20.154
- 98.913
- 41.915
- 59.092
- 56.773
- 42,702
- 6,173
- 303.061
- 8,6
- 6,7
- 32,6
- 13,8
- 19,5
- 18,7
- 14,1
- 2,0
- 100
(2) Datos provisionales al 24.1.2011
(3) Eólica,Biogás, Biomasa, R.S.U., eólica y solar fotovoltaica y termoeléctrica.
Fuente: Secretaría de Estado de Energía. Ministerio de Industria, Turismo y Comercio.
The outcome for physical international exchanges reveals an export balance of approximately 8,500 GWh, suggesting a positive balance with all four neighbouring countries.
In February, the demand for electrical energy increased 5.8% as regards February 2009, 8.7% in March, 6.5% in April and 7.3% in November.
The initial months of 2010 were also significant in terms of the power from renewable sources. This can be explained by the strong increase in wind generation (40% in the first term, with instantaneous wind power generation standing at a record of almost 13,000 MWh, on February 24, for instance) and hydroelectric energy, with a 90% progression in the first third of the year (February was the wettest month in the last twenty years). This situation left limited breathing space for non-basic thermal generation, such as coal groups and natural gas combined cycles.
- INDUSTRY
- Coal
- Oil Products
- Natural gas
- Electricity
- TRANSPORT
- Coal
- Oil Products
- Natural gas
- Electricity
- SUNDRY USES
- Coal
- Oil Products
- Natural gas
- Electricity
- TOTAL by Final Energy
- Coal
- Oil Products
- Natural gas
- Electricity
- TOTAL by Sector
- INDUSTRY
- TRANSPORT
- SUNDRY USES
- 24.423
- 3.893
- 11.306
- 3.677
- 5.547
- 22.716
- 0
- 22.478
- 0
- 238
- 13.531
- 378
- 7.109
- 854
- 5.190
- 60.669
- 4.271
- 40.893
- 4.531
- 10.974
- 60.669
- 24.423
- 22.716
- 13.531
- 100,0
- 15,9
- 46,3
- 15,1
- 22,7
- 100,0
- 0,0
- 99,0
- 0,0
- 1,0
- 100,0
- 2,8
- 52,5
- 6,3
- 38,4
- 100,0
- 7,0
- 67,4
- 7,5
- 18,1
- 100,0
- 40,3
- 37,4
- 22,3
- 32.816
- 2.466
- 13.350
- 9.602
- 7.408
- 32.275
- 0
- 31.913
- 0
- 362
- 21.671
- 80
- 10.365
- 2.690
- 8.536
- 86.772
- 2.546
- 55.628
- 12.292
- 16.306
- 86.772
- 32.826
- 32.275
- 21.671
- 100,0
- 7,5
- 40,7
- 29,3
- 22,6
- 100,0
- 0,0
- 98,9
- 0,0
- 1,1
- 100,0
- 0,4
- 47,8
- 12,4
- 39,4
- 100,0
- 2,9
- 64,1
- 14,2
- 18,8
- 100,0
- 37,8
- 37,2
- 25,0
- 35.151
- 2.286
- 9.955
- 13.360
- 9.550
- 40.717
- 0
- 40.243
- 0
- 474
- 28.302
- 31
- 11.729
- 4.395
- 12.147
- 104.170
- 2.317
- 61.927
- 17.755
- 22.171
- 104.170
- 35.151
- 40.717
- 28.302
- 100,0
- 6,5
- 28,3
- 38,0
- 27,2
- 100,0
- 0,0
- 98,8
- 0,0
- 1,2
- 100,0
- 0,1
- 41,4
- 15,5
- 42,9
- 100,0
- 2,2
- 59,4
- 17,0
- 21,3
- 100,0
- 33,7
- 39,1
- 27,2
- 35.037
- 2.059
- 10.863
- 12.642
- 9.473
- 39.301
- 0
- 38.822
- 0
- 479
- 26.846
- 20
- 9.910
- 4.614
- 12.302
- 101.184
- 2.079
- 59.595
- 17.256
- 22.254
- 101.184
- 35.037
- 39.301
- 26.846
- 100,0
- 5,9
- 31,0
- 36,1
- 27,0
- 100,0
- 0,0
- 98,8
- 0,0
- 1,2
- 100,0
- 0,1
- 36,9
- 17,2
- 45,8
- 100,0
- 2,1
- 58,9
- 17,1
- 22,0
- 100,0
- 34,6
- 38,8
- 26,5
- 30.985
- 1,432
- 10.107
- 10.853
- 8.593
- 36.868
- 0
- 36.393
- 0
- 475
- 25.177
- 21
- 8.887
- 4.330
- 11.939
- 93.030
- 1.453
- 55.387
- 15.183
- 21.007
- 93.030
- 30.985
- 36.868
- 25.177
- 100,0
- 4,6
- 32,6
- 35,0
- 27,7
- 100,0
- 0,0
- 98,7
- 0,0
- 1,3
- 100,0
- 0,1
- 35,3
- 17,2
- 47,4
- 100,0
- 1,6
- 59,5
- 16,3
- 22,6
- 100,0
- 33,3
- 39,6
- 27,1
Photovoltaic energy has experienced a strong development in recent years, with a notable halt in 2010. Installed power (approximately 3,000 MW, equivalent to three nuclear power stations) has caused problems for the electric system operator, given the lack of instant information regarding actual production. In any case, it is another significant element for power generation during the central hours of the day, particularly during the hotter months.
- OF FINAL ENERGY
- Industry
- Transport
- Residential-Commercial
- IN R-C MARKET:
- Gasoil
- Natural gas
- Electricity
- In Domestic market
- 2.296
- 738
- 565
- 993
- 267
- 255
- 198
- 670
- 2.298
- 670
- 703
- 925
- 163
- 318
- 245
- 600
- 2,407
- 676
- 743
- 988
- 157
- 362
- 272
- 624
- 2.348
- 639
- 752
- 957
- 138
- 344
- 283
- 596
- 1.237
- 490
- 393
- 354
- 116
- 5
- 97
- 230
- 1.983
- 636
- 820
- 527
- 127
- 66
- 212
- 296
- 2.264
- 723
- 920
- 622
- 149
- 101
- 263
- 352
- 2.107
- 591
- 888
- 628
- 106
- 118
- 302
- 347
There is only one operative power plant outside Spain, which is located in Germany. Seven plants are being built outside Spain and 26 are currently in the planning stage. Spain has 16 plants that are currently operating, another 16 are in the construction phase and 32 are in the planning stage, as revealed by data provided at the 4th International Summit on thermo-electric solar energy staged in Seville in late November 2010.
The capacity for the biodiesel production in Spain stands at around 4.2 million tons, showing a 3% drop as regards the figure for the previous year. Said production only represents 10% of the plant capacity, according to sectorial sources. 60% of the biodiesel was imported, in some cases from countries with aids established for this purpose.
The development of electric interconnections between Spain and France is advancing according to plan (the first stage of the new interconnection was submitted for public consultation in October), and the new very high power line is expected to be operative in 2014.
As regards Portugal, between 2014 and 2015 interconnections between said country and Spain should suffice to ensure the single electricity market is operative at all times.
If we analyse the final destination of consumption using official data for 2009, the transport sector was once again last year the biggest consumer of final energy, accounting for 38.9%. In second place was industry, with around 31%, and in third position sundry uses (around 25%), with household consumption being the most significant.
As regards the evolution compared to 2008, the figures under study, and published in 2010, show the known drop in energy consumption in transport in 2009 (-6.2%), as a consequence of the increase in energy prices and the economic crisis. This situation also appeared in the industrial sector, where the total consumption dropped 11.6% in 2009.
If we turn to final consumption in Spain in certain specific markets, and compare this with the same average consumption for the EU, we find that in the residential market energy consumption per inhabitant in the EU is 72% higher than the equivalent in Spain, a difference resulting from the milder Spanish winters. It is interesting to note that in 1985 the average final energy consumption per inhabitant in the EU was 2.9% higher in the EU (data from EU 25 in this case) than in Spain.
- Coal
- Oil products
- Natural gas
- Nuclear
- Renewable Energy
- Pumped Hydro
- TOTAL
- 37,403
- 20,380
- 110,387
- 52,732
- 72,809
- 2,797
- 296,508
- 12.6
- 6.9
- 37.2
- 17.8
- 24.6
- 0.9
- 100.0
- 31,579
- 9,921
- 148,501
- 55,600
- 139,636
- 8,023
- 393,260
- 8.0
- 2.5
- 37.8
- 14.1
- 35.5
- 2.0
- 100.0
- Coal
- Oil products
- Natural gas
- Nuclear
- Renewable Energy
- Pumped Hydro
- TOTAL
- 81,458
- 24,261
- 82,819
- 57,539
- 41,741
- 5,153
- 292,971
- 27.8
- 8.3
- 28.3
- 19.6
- 14.2
- 1.8
- 100.0
- 29,710
- 18,535
- 108,829
- 56,000
- 82,631
- 3,640
- 299,345
- 9.9
- 6.2
- 36.4
- 18.7
- 27.6
- 1.2
- 100.0
- 33,630
- 9,381
- 134,220
- 55,600
- 113,325
- 6,577
- 352,733
- 9.5
- 2.7
- 38.1
- 15.8
- 32.1
- 1.9
- 100.0
- 33,500
- 8,721
- 165,791
- 55,600
- 152,835
- 8,023
- 424,470
- 7.9
- 2.1
- 39.1
- 13.1
- 36.0
- 1.9
- 100.0
(1) Includes electricity production by seft producers
Source: Plan de acción nacional de energías renovables (PANER) 2011-2020.
Ministerio de Industria, Turismo y Comercio and IDAE. June 2010