

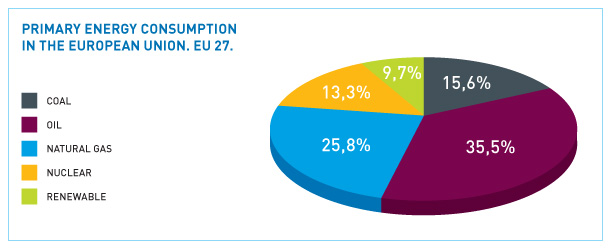
Oil remains the European Union’s main primary energy source, with a 35% share. Natural gas slides into second place, with a share that could come close to 26% of the EU’s primary energy consumption in 2010.
Hydrocarbons, altogether, satisfied 88% of the world’s energy needs in 2010. Natural gas’s share in 2010’s global energy consumption may reach 24.5%.
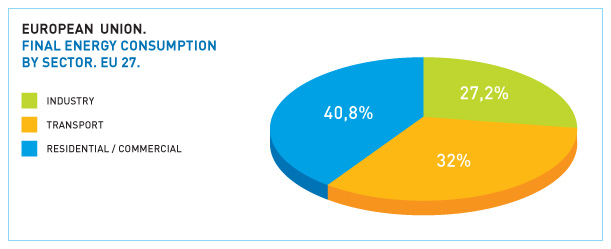
In terms of end-use energy consumption, the residential-commercial market continues to hold top position, with a rounded share of 40%. Transport continues its gradual upward trend, with a 32% share this past year. This progress comes at the expense of the industrial sector, within the percentage breakdown of sectoral energy consumption. This pattern is the result of Europe’s limited specialisation in high-energy industry, increased efficiency and, furthermore, the European population’s heightened mobility.
- Coal
- Oil
- Natural gas
- Nuclear (3)
- Hydroelec.(4)
- WORLD TOTAL
- OECD
- 2.258,3
- 3.235,4
- 1.913,2
- 600,0
- 216,6
- 8.223,5
- 4.770,1
- 27,5
- 39,3
- 23,3
- 7,3
- 2,6
- 100,0
- 58,0
- 2.337,6
- 3.562,1
- 2.175,7
- 584,3
- 601,1
- 9.259,8
- 5.352,4
- 25,2
- 38,5
- 23,5
- 6,3
- 6,5
- 100,0
- 57,8
- 2.904,0
- 3.877,8
- 2.498,3
- 626,8
- 658,5
- 10.565,4
- 5.545,8
- 27,5
- 36,7
- 23,6
- 5,9
- 6,2
- 100,0
- 52,5
- 3.278,3
- 3.882,1
- 2.653,1
- 610,5
- 740,3
- 11.164,3
- 5.217,1
- 29,4
- 34,8
- 23,8
- 5,5
- 6,6
- 100,0
- 46,7
- 3.409
- 3.951
- 2.812
- 620
- 745
- 11.537
- 5.295
- 29,4
- 34,2
- 24,4
- 5,4
- 6,5
- 100,0
- 45,9
(2) Estimate
(3) (4) Calculation methodology modified by BP from its June 2002 report onwards. The new methodology (applied to every year of the series) assumes a value for nuclear and hydroelectric primary energy in terms equivalent to the energy required to generate the same quantity of electricity at a conventional power station, assuming a conversion efficiency of 38%.
Previously hydroelectric generation was considered as primary energy equivalent to the electricity produced, while for nuclear energy the efficiency factor used in the conversion was 33%.
One of the consequences of this change in a methodology is an increase in the total consumption of primary energy in every area and a reduction of the relative weighting of other energy sources, including natural gas.
This new methodology employed by BP is not used by Eurostat or the IEA, which, for hydroelectric and nuclear power, equate energy output at terminals to primary energy.
Source: BP Statistical Review of World Energy, Monthly Natural Gas Survey (IEA), Monthly Oil Survey (IEA) and prepared by Sedigas.
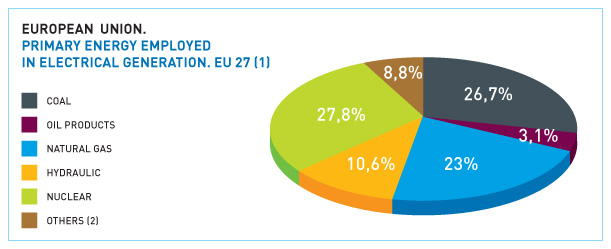
Within the realm of electricity generation, nuclear energy and coal move into the top two positions as the European Union's most used energy sources. Nuclear energy's strong presence in France is a determining factor in this situation.
- North America
- USA
- Canada
- Central and Sur America
- Argentina
- Brazil
- Mexico
- Venezuela
- Chile
- Colombia
- Europe
- Germany
- Austria
- Belgium and Luxembourg
- Bulgaria
- Denmark
- Spain
- Finland
- France
- Greece
- Ireland
- Italy
- Netherlands
- Poland
- Portugal
- United Kingdom
- Czech Republic
- Romania
- Sweden
- CIS
- Russian Fed.
- Ukraine
- Middle East
- Iran
- Saudi Arabia
- Kuwait
- UAE
- Africa
- South Africa
- Egypt
- Algeria
- China and India
- Australia
- South Korea
- China
- India
- Japan
- Indonesia
- TOTAL WORLD
- OCDE
- 37,6
- 38,6
- 30,4
- 47,0
- 30,5
- 46,2
- 52,4
- 37,2
- 54,8
- 30,3
- 40,2
- 39,3
- 43,3
- 55,4
- 25,4
- 50,6
- 50,4
- 39,4
- 36,2
- 61,8
- 58,0
- 45,9
- 52,9
- 27,6
- 57,6
- 37,4
- 24,4
- 28,6
- 31,8
- 20,2
- 19,7
- 12,5
- 51,0
- 40,8
- 63,6
- 61,3
- 29,1
- 40,0
- 19,2
- 44,2
- 37,5
- 29,1
- 35,8
- 43,9
- 18,6
- 31,7
- 42,6
- 48,4
- 34,8
- 39,7
- 26,9
- 27,0
- 26,7
- 25,3
- 53,0
- 8,1
- 38,4
- 36,4
- 10,7
- 26,9
- 25,2
- 24,2
- 28,0
- 22,4
- 12,7
- 24,7
- 24,6
- 12,7
- 15,9
- 9,2
- 31,2
- 39,4
- 37,5
- 13,3
- 17,4
- 39,2
- 18,6
- 35,3
- 2,3
- 50,9
- 55,2
- 37,5
- 47,2
- 57,9
- 36,4
- 38,7
- 70,9
- 23,4
- 0,0
- 50,3
- 60,5
- 10,8
- 19,4
- 12,8
- 3,7
- 10,0
- 17,0
- 25,7
- 23,8
- 25,0
- 21,0
- 22,8
- 8,3
- 4,0
- 1,5
- 5,2
- 4,2
- 0,0
- 14,6
- 10,7
- 16,2
- 24,5
- 7,7
- 6,6
- 36,4
- 24,7
- 9,5
- 14,7
- 4,2
- 24,2
- 9,4
- 8,2
- 8,5
- 58,3
- 16,1
- 14,9
- 39,8
- 17,9
- 3,7
- 16,9
- 13,0
- 31,1
- 1,4
- 0,7
- 0,0
- 0,0
- 0,0
- 29,7
- 78,5
- 1,4
- 1,8
- 51,9
- 42,6
- 28,9
- 70,6
- 52,4
- 23,5
- 23,8
- 29,4
- 19,9
- 8,4
- 8,7
- 6,4
- 1,0
- 2,5
- 1,3
- 1,3
- 0,0
- 0,0
- 0,0
- 11,7
- 10,5
- 0,0
- 15,4
- 20,2
- 0,0
- 10,8
- 21,5
- 38,4
- 0,0
- 0,0
- 0,0
- 1,1
- 0,0
- 0,0
- 7,9
- 15,4
- 7,8
- 27,6
- 5,8
- 5,8
- 16,5
- 0,0
- 0,0
- 0,0
- 0,0
- 0,0
- 0,7
- 2,1
- 0,0
- 0,0
- 3,0
- 0,0
- 14,1
- 0,7
- 0,8
- 13,4
- 0,0
- 5,5
- 9,7
- 6,1
- 2,9
- 28,3
- 22,6
- 12,6
- 39,2
- 3,7
- 26,5
- 19,9
- 32,1
- 6,8
- 1,4
- 21,0
- 0,1
- 5,2
- 0,0
- 4,7
- 11,6
- 5,4
- 4,9
- 1,4
- 6,4
- 0,0
- 0,8
- 8,9
- 0,6
- 1,8
- 10,4
- 34,6
- 6,2
- 6,3
- 2,4
- 0,4
- 0,6
- 0,0
- 0,0
- 0,0
- 6,1
- 0,2
- 4,1
- 0,3
- 5,2
- 2,2
- 0,3
- 6,4
- 5,1
- 3,6
- 2,1
- 6,6
- 5,7
- 100,0
- 100,0
- 100,0
- 100,0
- 100,0
- 100,0
- 100,0
- 100,0
- 100,0
- 100,0
- 100,0
- 100,0
- 100,0
- 100,0
- 100,0
- 100,0
- 100,0
- 100,0
- 100,0
- 100,0
- 100,0
- 100,0
- 100,0
- 100,0
- 100,0
- 100,0
- 100,0
- 100,0
- 100,0
- 100,0
- 100,0
- 100,0
- 100,0
- 100,0
- 100,0
- 100,0
- 100,0
- 100,0
- 100,0
- 100,0
- 100,0
- 100,0
- 100,0
- 100,0
- 100,0
- 100,0
- 100,0
- 100,0
- 100,0
- 100,0
- 2.501,2
- 2.182,0
- 319,2
- 726,1
- 73,2
- 225,7
- 163,3
- 73,7
- 28,1
- 29,0
- 1.774,8
- 289,8
- 30,0
- 69,5
- 17,3
- 16,2
- 126,5
- 25,1
- 242,0
- 32,7
- 13,8
- 163,5
- 93,3
- 92,4
- 22,4
- 198,9
- 39,7
- 34,6
- 43,1
- 995,3
- 635,3
- 112,7
- 658,9
- 204,8
- 191,5
- 31,3
- 75,0
- 360,8
- 126,6
- 76,2
- 39,7
- 4.147,1
- 119,2
- 237,4
- 2.177,0
- 468,83
- 463,9
- 128,2
- 11.164,2
- 5.217,1
Source: BP Statistical Review of World Energy and prepared by Sedigas. .
Wind energy now provides more than 3.5% of the electricity consumed in Europe, a 1.4 point increase over the last three years.
The US is developing eight new reactors that will be operational towards the end of the current decade. According to the German Government, extending the German plants’ expected 32-year lifespan by between 8 and 14 years aims to ensure the electrical supply, reduce CO2 emissions and facilitate the development of renewable energy. In the United Kingdom, the new nuclear power stations will commence operations in 2018, many in the same location as current stations. Finland has approved the construction of two new reactors. Other countries have followed suit: Japan plans to have eight operational power stations by 2020 and at least six more by 2030. Northern Poland will play home to the country’s first plant.
As in recent years, the promotion of renewable energy sources remains an extremely prominent energy policy target, hence the fact its share in total energy consumption continues to rise.
- Coal
- Oil
- Natural gas
- Nuclear
- Renewable
- TOTAL
- 325,1
- 674,2
- 438,0
- 255,3
- 129,1
- 1.821,7
- 17,8
- 37,0
- 24,0
- 14,0
- 7,1
- 100,0
- 329,1
- 658,6
- 432,5
- 241,3
- 143,1
- 1.804,6
- 18,2
- 36,5
- 24,0
- 13,4
- 7,9
- 100,0
- 307,5
- 638,3
- 440,0
- 228,6
- 146,8
- 1.761,2
- 17,5
- 36,2
- 25,0
- 13,0
- 8,3
- 100,0
- 268,5
- 590
- 414
- 222
- 150
- 1.644,7
- 16,3
- 35,9
- 25,2
- 13,5
- 9,1
- 100,0
- 265
- 602
- 437
- 225
- 165
- 1.694,1
- 15,6
- 35,5
- 25,8
- 13,3
- 9,7
- 100,0
(2) Estimate.
Source: Energy Yearly Statistics 2008 and Statistics in Focus. Eurostat. European Commission. Luxembourg. 2010; Eurogas; Monthy Oil Survey (IEA) and prepared by Sedigas.
Many countries are also in the construction phase of harnessing power from new renewable energy sources. Offshore wind energy is beginning to yield commendable results. The United Kingdom, for example, launched the world’s largest wind farm in late September, with one-hundred turbines located 11km off the Kent shoreline. Four years from now, the Thanet farm is expected to feature some 341 turbines.
- Industry
- Transport
- Residential-Commerc.
- TOTAL
- 336,7
- 362,1
- 482,4
- 1.181,2
- 28,5
- 30,7
- 40,8
- 100,0
- 332,3
- 364,7
- 485,4
- 1.182,4
- 28,1
- 30,8
- 41,1
- 100,0
- 328,3
- 372,2
- 485,6
- 1.186,1
- 27,7
- 31,4
- 40,9
- 100,0
- 330,6
- 376,8
- 457,4
- 1.164,8
- 28,4
- 32,3
- 39,3
- 100,0
- 317,9
- 374,3
- 476,5
- 1.168,7
- 27,2
- 32,0
- 40,8
- 100,0
- Coal
- Oil Products
- Natural gas
- Hydraulic
- Nuclear
- Other (2)
- Where wind:
- TOTAL
- 969.245
- 139.123
- 661.589
- 341.744
- 997.699
- 201.002
- 70.485
- 3.310.402
- 29,3
- 4,2
- 20,0
- 10,3
- 30,1
- 6,1
- - -
- 100,0
- 986.968
- 131.932
- 681.668
- 344.348
- 989.877
- 218.721
- 82.306
- 3.353.514
- 29,4
- 3,9
- 20,3
- 10,3
- 29,5
- 6,5
- - -
- 100,0
- 961.617
- 110.030
- 733.291
- 344.236
- 935.277
- 283.241
- 104.337
- 3.367.692
- 28,6
- 3,3
- 21,8
- 10,3
- 27,8
- 8,4
- - -
- 100,0
- 901.268
- 104.498
- 774.773
- 359.185
- 937.236
- 297.222
- 118.733
- 3.374.182
- 26,7
- 3,1
- 23,0
- 10,6
- 27,8
- 8,8
- - -
- 100,0
(2) Wind, solar, geothermal, derivative gases, biomass and urban and industrial waste.
Source: Energy Yearly Statistics 2008. Eurostat. European Commission. Luxembourg. 2010. Prepared by Sedigas.

-
 NATURGAS
 -
 ENDESA