

Gas in Spain
>
Demand for natural gas
>
Key data
Key data
During the first quarter of the year, demand dropped by 16.8%. This situation was mainly caused by the considerable tailing off in demand for natural gas for electrical generation. Between January and May the monthly reduction in demand was greater than 20%, with the figure for February as high as 42%. During that month hydroelectric generation increased by 210%, and wind power by 56%.
The remaining months of the year also saw declines in demand, although not as severe. For example, in the third quarter the drop in sales was 5.4%, while there was an overall increase in sales in December of 5.3%, with positive changes in the generation and conventional markets.
However, the final quarter did overall maintain the downward trend. One of the reasons for this behaviour was the warm weather in October and November, which was not balanced out by the increase in demand (compared with 2008) in the residential market in the month of December.
On 16 December the Spanish gas system hit a historic record for natural gas transmission of 1885 GWh. This record figure was mainly the result of the low temperatures recorded in the preceding days and the relatively moderate level of wind power output, along with the need for natural gas to supplement electrical demand, which also increased.
One other notable feature of 2009 was the rise in exports, to a level of 11,554 GWh, 5.4 times the figure for 2008. Demand for natural gas from clients of Spanish energy groups overseas is very much on the increase, a situation which will continue over the coming years, as demonstrated by the Open Season held in September 2009 (see the Open Season 2009 section).
SALES OF NATURAL GAS
(GWh)
- MARKET
- 1. RESIDENTIAL-COMMERCIAL
- Natural gas
- Gas manufactured from NG
- 1.1 Subtotal natural gas
- Propane-air mix
- 1.2. Subtotal other gases
- 2. INDUSTRIAL
- 3. ELECTRICITY PLANTS
- 4. NON-ENERGY USE
- 5. TOTAL NATURAL GAS (1.1+2+3+4)
- TOTAL (1.2+5)
- TOTAL Sales of natural gas (bcm)
2000
- 34.755
- 34.221
- 31
- 34.253
- 502
- 502
- 144.994
- 10.379
- 6.131
- 195.756
- 196.258
- 16,8
2005
- 56.425
- 55.856
- 0
- 55.856
- 568
- 568
- 202.278
- 111.320
- 6.199
- 375.653
- 376.221
- 32,3
2006
- 51.995
- 51494
- 0
- 51.494
- 501
- 501
- 199.167
- 134.664
- 5.698
- 391.023
- 391.524
- 33,6
2007
- 56.785
- 56.231
- 0
- 56.231
- 554
- 554
- 203.391
- 142.057
- 6.158
- 407.837
- 408.391
- 35,1
2008
- 59.617
- 59.044
- 0
- 59.044
- 573
- 573
- 197.256
- 187.534
- 5.033
- 448.868
- 449.441
- 38,6
2009
- 55.945
- 55.497
- 0
- 55.497
- 448
- 448
- 180.264
- 160.888
- 4.874
- 401.523
- 401.971
- 34,5
Source: Sedigas
DISTRIBUTION OF NATURAL GAS SALES (%)
- MARKET
- RESIDENTIAL-COMMERCIAL
- INDUSTRIAL
- ELECTRICITY PLANTS (1)
- NON-ENERGY USES
- TOTAL
1985
- 16,1
- 57,6
- 25,6
- 0,6
- 100,0
1990
- 16,6
- 71,9
- 3,7
- 7,9
- 100,0
1995
- 18,9
- 73,6
- 0,9
- 6,6
- 100,0
2000
- 17,5
- 74,1
- 5,3
- 3,1
- 100,0
2005
- 14,9
- 53,8
- 29,6
- 1,7
- 100,0
2006
- 13,2
- 50,9
- 34,4
- 1,5
- 100,0
2007
- 13,8
- 49,9
- 34,8
- 1,5
- 100,0
2008
- 13,2
- 43,9
- 41,8
- 1,1
- 100,0
2009
- 13,8
- 44,9
- 40,1
- 1,2
- 100,0
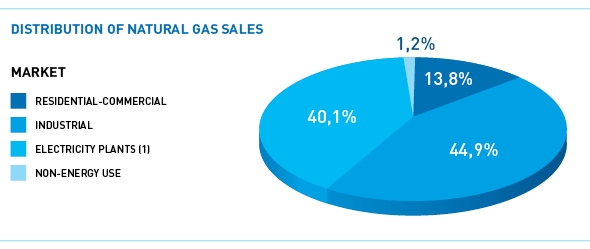
(1) This does not include sales for the generation of electricity by cogeneration, which is included under the relevant market.
YEAR-ON-YEAR CHANGE IN SALES OF NATURAL GAS (%)
- MARKET
- 1. RESIDENTIAL-COMMERCIAL
- Natural gas
- Gas manufactured from NG
- 1.1 Subtotal natural gas
- Propane-air mix
- 1.2. Subtotal other gases
- 2. INDUSTRIAL
- 3. ELECTRICITY PLANTS
- 4. NON-ENERGY USES
- 5. TOTAL NATURAL GAS (1.1+2+3+4)
- TOTAL (1.2+5)
2000
- 7,4
- 7,2
- -48,9
- 7,1
- 52,0
- 27,3
- 12,6
- 35,2
- 0,5
- 12,1
- 12,2
2001
- 16,7
- 17,4
- -94,4
- 17,3
- -24,3
- -24,3
- 5,5
- 22,7
- -0,7
- 8,3
- 8,2
2002
- 7,0
- 6,6
- -100,0
- 6,6
- 41,1
- 41,1
- 9,2
- 115,0
- -5,5
- 14,7
- 14,7
2003
- 10,1
- 10,4
- --
- 10,4
- -15,3
- -15,3
- 9,0
- 46,3
- 5,8
- 13,3
- 13,3
2004
- 8,9
- 8,8
- --
- 8,8
- 9,8
- 9,8
- 7,8
- 65,0
- -6,6
- 16,0
- 16,0
2005
- 8,5
- 8,5
- --
- 8,5
- 13,7
- 13,7
- 3,1
- 68,4
- 9,0
- 17,6
- 17,6
2006
- -7,9
- -7,8
- --
- -7,8
- -11,8
- -11,8
- -1,5
- 21,0
- -8,1
- 4,1
- 4,1
2007
- 9,2
- 9,2
- --
- 9,2
- 10,6
- 10,6
- 2,1
- 5,5
- 8,1
- 4,3
- 4,3
2008
- 5,0
- 5,0
- ----
- 5,0
- 3,4
- 3,4
- -3,0
- 32,0
- -18,3
- 10,1
- 10,1
2009
- -6,2
- -6,0
- ----
- -6,0
- -21,8
- -21,8
- -8,6
- -14,2
- -3,2
- -10,5
- -10,6

Annual Report 2.009: Sedigas - The Spanish Gas Association