

According to the IEA (Monthly Natural Gas Survey) the cumulative data up to November confirm forecasts of an almost universal fall in demand for natural gas.
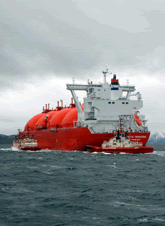
One of the consequences of this situation is the deferral by several months of the operational start-up of a number of LNG production projects, along with the existence of excess transportation capacity (in 2009 some 27 LNG transport vessels were delivered, compared with 44 in 2008).
- North America
- USA
- Canada
- Central & South America
- Mexico
- Venezuela
- Argentina
- Trinidad & Tobago
- Bolivia
- Brazil
- Europe (2)
- Norway
- United Kingdom
- Netherlands
- Germany
- Italy
- Romania
- Eastern Europe and CIS
- Russia (3)
- Turkmenistan
- Uzbekistan
- Kazakhstan
- Ukraine
- Azerbaijan
- Africa
- Algeria
- Egypt
- Nigeria
- Libya
- Middle East
- Saudi Arabia
- Iran
- Abu Dhabi
- Qatar
- Asia-Oceanía
- Indonesia
- Malaysia
- Australia
- Pakistan
- China
- India
- TOTAL WORLD
- 651,8
- 595,1
- 56,7
- 34,5
- 12,6
- 9,0
- 6,0
- ---
- n.d.
- n.d.
- 79,7
- 0,0
- 11,1
- 33,4
- 13,9
- 13,1
- 24,9
- 234,2
- 197,9
- n.d.
- n.d.
- n.d.
- n.d.
- n.d.
- 3,4
- 2,8
- 0,1
- ---
- 0,3
- 19,5
- 0,8
- 12,0
- 0,7
- ---
- 17,0
- 1,3
- 0,9
- 1,5
- 3,8
- 3,4
- 0,3
- 1.040,1
- 624,4
- 549,6
- 74,8
- 65,5
- 28,6
- 14,8
- 9,4
- ---
- 0,4
- 0,3
- 199,1
- 26,6
- 37,3
- 90,3
- 27,5
- 12,5
- 34,3
- 484,4
- 434,4
- n.d.
- n.d.
- n.d.
- n.d.
- n.d.
- 27,2
- 18,0
- 2,9
- 1,1
- 5,2
- 44,1
- 10,2
- 8,0
- 7,2
- 3,3
- 74,1
- 18,5
- 1,1
- 9,5
- 8,1
- 14,3
- 12,7
- 1.518,8
- 611,7
- 504,9
- 106,8
- 85,0
- 26,7
- 21,4
- 17,8
- 4,7
- 2,7
- 3,4
- 196,7
- 27,1
- 49,6
- 72,4
- 23,4
- 17,3
- 28,3
- 855,1
- 814,6
- 73,7
- 34,3
- 6,0
- 23,6
- 8,3
- 70,9
- 51,6
- 8,1
- 4,0
- 6,2
- 99,9
- 30,5
- 24,2
- 15,3
- 6,3
- 149,0
- 45,4
- 18,5
- 18,4
- 14,4
- 14,4
- 10,6
- 2.068,3
- 720,8
- 537,6
- 183,2
- 134,1
- 35,8
- 30,5
- 37,4
- 14,1
- 3,2
- 7,2
- 280,3
- 52,9
- 108,3
- 67,8
- 21,2
- 15,7
- 13,6
- 746,6
- 584,2
- 47,0
- 56,4
- 11,5
- 18,0
- 5,7
- 125,7
- 83,2
- 18,3
- 12,5
- 5,9
- 213,2
- 49,8
- 60,2
- 27,5
- 29,1
- 271,2
- 66,8
- 48,4
- 32,3
- 22,8
- 27,1
- 22,5
- 2.491,9
- 697,6
- 511,8
- 185,8
- 177,4
- 39,1
- 28,7
- 45,6
- 31,0
- 10,4
- 11,4
- 298,5
- 87,0
- 87,8
- 72,8
- 16,6
- 12,1
- 12,4
- 775,2
- 596,9
- 59,0
- 55,7
- 23,7
- 19,3
- 5,7
- 172,8
- 88,0
- 42,5
- 22,4
- 11,3
- 317,3
- 71,2
- 100,9
- 38,2
- 45,8
- 361,6
- 73,8
- 63,5
- 38,9
- 30,8
- 48,0
- 29,9
- 2.800,4
- 719,6
- 540,2
- 179,4
- 193,2
- 46,3
- 26,5
- 44,8
- 39,0
- 14,1
- 9,8
- 290,8
- 89,7
- 72,3
- 68,3
- 15,1
- 9,7
- 11,6
- 795,6
- 611,5
- 64,6
- 61,2
- 27,8
- 19,5
- 10,8
- 193,5
- 84,8
- 46,5
- 32,5
- 15,3
- 356,6
- 74,4
- 111,9
- 40,7
- 63,2
- 390,8
- 68,6
- 55,5
- 43,7
- 36,8
- 67,9
- 31,4
- 2.940,0
- 745,3
- 574,1
- 171,2
- 197,3
- 46,6
- 24,1
- 44,1
- 39,3
- 14,7
- 12,6
- 307,5
- 99,2
- 69,9
- 80,0
- 15,6
- 9,1
- 10,7
- 814,7
- 621,3
- 66,1
- 63,4
- 31,4
- 19,8
- 12,5
- 212,4
- 86,5
- 59,0
- 31,7
- 15,9
- 382,6
- 80,4
- 116,3
- 40,8
- 77,0
- 415,4
- 70,0
- 61,2
- 47,5
- 37,5
- 76,1
- 32,2
- 3.075,1
- 734,7
- 584,3
- 150,4
- 193,3
- 48,3
- 23,1
- 41,4
- 40,6
- 12,6
- 10,3
- 290,1
- 103,5
- 58,6
- 74,1
- 14,6
- 8,0
- 11,0
- 711,1
- 546,8
- 35,7
- 62,3
- 33,5
- 19,9
- 12,8
- 201,8
- 81,2
- 62,7
- 23,2
- 15,3
- 405,8
- 77,1
- 131,2
- 39,5
- 89,3
- 434,1
- 72,4
- 58,6
- 52,6
- 37,9
- 82,0
- 38,7
- 2.971,0
(2) EU 25 plus Norway, Switzerland and Turkey.
(3) Includes total figures for the former USSR/CIS until 1995 inclusive. From 2000, only refers to data from the Russian Federation.
Source: CEDIGAZ
Across the OECD countries as a whole natural gas consumption had fallen by 4.4% up to November, compared with the same period in 2008.
North America saw a slight increase in production, calculated at 1.2%, and a decline in consumption of 3.1%. In Canada, natural gas production fell by 8.2% as a result of low prices and the increase in production in the USA.
In the OECD Pacific region consumption fell by 3.1%, while production increased by 8.9%. Particular mention should be made here of the upward trend in natural gas output in Australia, up more than 11%.
The IEA estimates for the USA suggest that the natural gas marketed in the country would have risen by 3.7% during 2009, despite a downturn of 59% in new drilling operations between September 2008 and July 2009. The increase in production was based on a rise in the productivity of the wells in operation. IEA expectations for production in the country in 2010 are for a reduction of 3%.
The same source confirms that natural gas consumption fell by 1.5% in 2009, mainly as a result of the economic crisis. Despite the low prices maintained throughout much of the year, which led to an increase in the use of gas by electrical power plants, the downturn in consumption in the industrial, domestic and commercial sectors led to an overall negative trend. Estimated consumption in 2010 would be similar to that seen in 2009. The increase in prices expected during the year would lead to a decline in use for generation, compensated by an increase in natural gas demand in other sectors.
Gas pipeline imports in the USA fell by 8.8% in 2009 according to the country's governmental energy agency. The IEA predicts that Canada will continue to see a downturn in production in 2010.
From sane to preliminary estimates of Cedigaz (Cedigaz First Estimates. May 2010),
The recession, which began in 2008 caused a sharp drop in natural gas demand, particularly for industrial uses. As demand conditions supply, world marketed gas supply recorded an historic 3.4% decline in 2009. This recession marked a halt in the gradual and substantial growth of world gas output recorded since 1998 and was the worst drop ever registered in the global gas business since the beginning of gas market developments worldwide.
With the exception of the Middle East (increases in Iran and Qatar) and Asia-Oceania (increases in Australia, China and India) all other geographical areas showed a fall in production. U.S. 2009 has become the largest producer of natural gas in the world, a position not held since the eighties of last century. The thrust of unconventional gas and not depend on exports, largely as is the case of Russia, is the cause of this fact.
The low prices in the U.S. market is the most important reason that natural gas demand in that country (number one for consumption in the world) has just fallen in 2009 despite the economic crisis.
The increase in reserves and consumption decrease in 2009 has pushed the ratio reserves / production: currently proven reserves of natural gas reached an equivalent consumption of 65.5 years.
- North America
- Central & South America
- Western Europe
- Eastern Europe and CIS
- Africa
- Middle East
- China and India
- TOTAL WORLD
- TOTAL Bcm(109 m3)
- 62,7
- 3,3
- 7,7
- 22,5
- 0,3
- 1,9
- 1,6
- 100,0
- 1.040,1
- 41,1
- 4,3
- 13,1
- 31,9
- 1,8
- 2,9
- 4,9
- 100,0
- 1.518,8
- 29,6
- 4,1
- 9,5
- 41,3
- 3,4
- 4,8
- 7,2
- 100,0
- 2.068,3
- 28,9
- 5,4
- 11,2
- 30,0
- 5,0
- 8,6
- 10,9
- 100,0
- 2.491,9
- 24,5
- 6,6
- 9,9
- 27,1
- 6,6
- 12,1
- 13,3
- 100,0
- 2.940,0
- 24,2
- 6,4
- 10,0
- 26,5
- 6,9
- 12,4
- 13,5
- 100,0
- 3.075,1
- 24,7
- 6,5
- 9,8
- 23,9
- 6,8
- 13,7
- 14,6
- 100,0
- 2.971,0
Within the context of the 9th Ministerial Meeting of Gas Producing and Exporting Countries, the 11 members of the Gas Exporters Forum signed an agreement in Qatar choosing Doha as the permanent headquarters for their organisation, and Russia's Leonid Bokhanovsky as the Secretary-General. A further step forward on the path towards coordination of commercial policies.
- North America
- USA
- Canada
- Central & South America
- Argentina
- Mexico
- Brazil
- Trinidad &Tobago
- Venezuela
- Chile
- Western Europe
- Germany
- United Kingdom
- Italy
- Netherlands
- France
- Spain
- CIS
- Russia
- Ukraine
- Uzbekistan
- Byelorussia
- Kazakhstan
- Turkmenistan
- Africa
- Algeria
- Egypt
- Middle East
- Iran
- Saudi Arabia
- China and India
- Japan
- China
- India
- South Korea
- Indonesia
- Malaysia
- Thailand
- Pakistan
- Australia
- TOTAL WORLD
- 705,4
- 614,0
- 91,4
- 168,9
- 40,4
- 47,9
- 18,7
- 16,7
- 28,2
- 7,6
- 536,2
- 91,6
- 95,1
- 85,3
- 44,2
- 49,3
- 33,6
- 653,8
- 436,9
- 76,0
- 58,0
- 20,1
- 19,9
- 16,5
- 81,2
- 24,6
- 34,2
- 262,9
- 102,4
- 71,2
- 392,0
- 79,0
- 48,0
- 35,9
- 30,5
- 37,5
- 33,2
- 32,6
- 30,8
- 24,1
- 2.800,4
- 716,0
- 620,9
- 95,1
- 180,7
- 41,8
- 52,9
- 19,3
- 20,2
- 26,0
- 7,5
- 537,8
- 92,6
- 91,0
- 87,8
- 40,4
- 49,9
- 35,2
- 649,3
- 417,3
- 70,3
- 54,8
- 20,5
- 27,1
- 14,3
- 81,6
- 25,6
- 28,3
- 290,7
- 108,7
- 73,5
- 419,1
- 85,3
- 59,6
- 38,8
- 34,3
- 27,9
- 26,1
- 33,3
- 36,1
- 25,6
- 2.875,2
- 733,6
- 648,3
- 85,3
- 184,9
- 43,9
- 55,6
- 19,9
- 20,2
- 26,6
- 4,1
- 548,0
- 86,2
- 91,9
- 83,5
- 36,3
- 46,9
- 35,2
- 632,1
- 426,2
- 71,2
- 47,8
- 20,6
- 32,8
- 16,9
- 87,2
- 26,5
- 30,6
- 302,3
- 113,0
- 74,4
- 451,9
- 92,7
- 71,8
- 41,4
- 34,6
- 34,6
- 24,2
- 35,4
- 36,8
- 23,6
- 2.940,0
- 745,0
- 661,1
- 83,9
- 193,0
- 44,5
- 59,3
- 23,7
- 21,9
- 25,6
- 2,3
- 570,6
- 88,1
- 94,9
- 85,8
- 42,9
- 49,2
- 39,0
- 646,7
- 440,2
- 75,0
- 48,3
- 21,1
- 36,4
- 10,3
- 102,3
- 27,7
- 42,1
- 330,4
- 119,3
- 80,4
- 485,8
- 96,2
- 80,5
- 43,0
- 36,8
- 33,8
- 31,1
- 37,3
- 37,5
- 27,3
- 3.075,1
- 738,8
- 659,8
- 79,0
- 188,5
- 43,1
- n.d.
- 18,7
- 21,4
- 24,9
- n.d.
- 539,4
- 90,6
- 87,5
- 77,2
- 43,2
- 49,1
- 34,6
- 559,3
- 367,5
- 64,9
- 50,5
- 17,6
- 38,9
- 5,8
- 102,0
- 25,8
- 44,4
- 343,9
- 131,3
- 77,1
- 494,9
- 89,6
- 89,6
- 51,3
- 34,3
- 35,9
- 28,8
- 39,2
- 37,9
- 28,3
- 2.971,0
- 24,9
- 22,2
- 2,7
- 6,3
- 1,5
- n.d.
- 0,6
- 0,7
- 0,8
- n.d.
- 18,2
- 3,0
- 2,9
- 2,6
- 1,5
- 1,7
- 1,2
- 18,8
- 12,4
- 2,2
- 1,7
- 0,6
- 1,3
- 0,2
- 3,4
- 0,9
- 1,5
- 11,6
- 4,4
- 2,6
- 16,7
- 3,0
- 3,0
- 1,7
- 1,2
- 1,2
- 1,0
- 1,3
- 1,3
- 1,0
- 100,0
| Electricity Generation | Industry | Residential | Other (1) | Total | Total | |||
| E. Plants. | Cogen. | Subtotal | and Commercial | (%) | (Tj) | |||
| USA | 24,5 | 7,7 | 32,2 | 20,7 | 33,4 | 13,7 | 100,0 | 25.012.669 |
| Canada | 6,7 | 3,4 | 10,0 | 28,2 | 31,1 | 30,6 | 100,0 | 3.752.341 |
| France | 1,2 | 13,5 | 14,6 | 23,2 | 47,1 | 15,0 | 100,0 | 1.789.846 |
| Italy | 22,1 | 18,3 | 40,4 | 22,6 | 33,2 | 3,8 | 100,0 | 3.234.576 |
| United Kingdom | 28,9 | 4,5 | 33,4 | 12,9 | 40,7 | 12,9 | 100,0 | 3.807.642 |
| Germany | 6,0 | 16,9 | 22,9 | 23,6 | 44,9 | 8,6 | 100,0 | 3.606.078 |
| Netherlands (2) | 9,3 | 23,9 | 33,2 | 16,1 | 30,8 | 19,9 | 100,0 | 1.553.568 |
| Spain | 33,9 | 9,9 | 43,9 | 29,0 | 14,8 | 12,3 | 100,0 | 1.471.227 |
| Belgium | 17,8 | 10,7 | 28,5 | 32,2 | 30,8 | 8,4 | 100,0 | 700.855 |
| Portugal | 43,5 | 15,4 | 58,9 | 27,2 | 10,2 | 3,7 | 100,0 | 177.158 |
| Czech Republic | 0,1 | 5,9 | 6,0 | 35,6 | 46,2 | 12,2 | 100,0 | 327.321 |
| Greece | 72,9 | 0,4 | 73,3 | 12,3 | 8,4 | 6,0 | 100,0 | 155.068 |
| Ireland | 57,1 | 5,4 | 62,5 | 15,0 | 21,2 | 1,3 | 100,0 | 203.266 |
| Austria | 7,9 | 21,1 | 29,0 | 33,5 | 25,3 | 12,3 | 100,0 | 324.582 |
| Poland | 0,0 | 7,6 | 7,6 | 25,0 | 38,3 | 29,0 | 100,0 | 572.318 |
| Hungary | 14,1 | 18,2 | 32,2 | 11,4 | 43,9 | 12,4 | 100,0 | 497.989 |
| Switzerland | 0,0 | 3,4 | 3,4 | 33,7 | 54,5 | 8,4 | 100,0 | 122.562 |
| Turkey | 45,8 | 6,2 | 52,0 | 12,2 | 32,8 | 3,0 | 100,0 | 1.415.312 |
| Japan | 59,5 | 0,0 | 59,5 | 8,9 | 28,2 | 3,4 | 100,0 | 4.164.088 |
| Australia | 27,5 | 6,0 | 33,5 | 30,1 | 13,6 | 22,7 | 100,0 | 1.301.352 |
| Mexico | 49,4 | 0,0 | 49,4 | 18,5 | 1,9 | 30,2 | 100,0 | 2.677.405 |
| Korea | 34,4 | 11,1 | 45,4 | 15,5 | 36,4 | 2,6 | 100,0 | 1.467.628 |
| OECD Europe | 18,7 | 13,2 | 31,9 | 20,5 | 35,6 | 12,0 | 100,0 | 20.891.797 |
| OECD N. America | 24,5 | 6,5 | 31,0 | 21,4 | 30,5 | 17,1 | 100,0 | 31.442.415 |
| OECD Pacific | 48,3 | 3,5 | 51,8 | 14,4 | 26,7 | 7,2 | 100,0 | 7.102.944 |
| Total OECD | 25,3 | 8,5 | 33,8 | 20,3 | 31,8 | 14,1 | 100,0 | 59.437.156 |
(2) In the year used as a reference, 8,4% of total natural gas consumption in the Netherlands was accounted for by agriculture.
Source: Energy Statistics of OECD Countries 2006-2007. I.E.A. Paris. 2009. Prepared by Sedigas.
- North America
- Central & South America
- OECD-Europe
- 'Eastern Europe and CIS
- Africa
- Middle East
- China and India
- TOTAL
- 651,4
- 33,8
- 82,2
- 236,7
- 1,9
- 18,5
- 15,6
- 1.040,1
- 628,4
- 62,7
- 235,4
- 457,1
- 18,6
- 41,5
- 75,1
- 1.518,8
- 612,4
- 85,5
- 290,1
- 792,1
- 39,5
- 95,1
- 153,6
- 2.068,3
- 723,2
- 132,8
- 431,0
- 659,6
- 59,5
- 192,2
- 293,8
- 2.491,9
- 705,4
- 168,9
- 536,2
- 653,8
- 81,2
- 262,9
- 392,0
- 2.800,4
- 733,6
- 184,9
- 548,0
- 632,1
- 87,2
- 302,3
- 451,9
- 2.940,0
- 745,0
- 193,0
- 570,6
- 646,7
- 102,3
- 330,4
- 485,8
- 3.075,1
- 738,8
- 188,5
- 539,4
- 559,3
- 102,0
- 343,9
- 494,9
- 2.971,0
- 24,9
- 6,3
- 18,2
- 18,8
- 3,4
- 11,6
- 16,7
- 100,0

-
 IBERDROLA