

Second place is taken by electricity, with a share of 24.4%, almost one point higher than the figure for 2008.
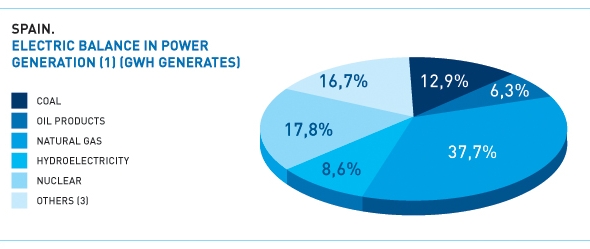
The use of coal as a final energy source continues to drop in absolute and relative terms. It now makes up only 1.8% of total energy consumed in final uses. It contributes 12.9% of energy used to generate electricity, a share which has been falling markedly over recent years.
- Coal
- Oil Products
- Gas (3)
- Electricity
- TOTAL
- 5.030
- 34.110
- 1.768
- 8.858
- 49.766
- 4.271
- 40.893
- 4.531
- 10.974
- 60.669
- 2.702
- 46.952
- 6.550
- 12.462
- 68.666
- 2.546
- 55.628
- 12.292
- 16.306
- 86.772
- 2.424
- 61.738
- 17.628
- 20.835
- 102.625
- 2.265
- 60.919
- 16.430
- 21.540
- 101.154
- 2.317
- 61.928
- 17.755
- 22.159
- 104.159
- 2.080
- 52.901
- 16.878
- 22.211
- 94.070
- 1.560
- 49.164
- 14.665
- 21.137
- 86.526
(2) Provisional data as at 8/02/2010
(3) Natural and manufactured gas.
Source: Secretaría de Estado de Energía. Ministerio de Industria, Turismo y Comercio.
- Coal
- Oil Products
- Gas
- Electricity
- TOTAL
- 10,1
- 68,5
- 3,6
- 17,8
- 100,0
- 7,0
- 67,4
- 7,5
- 18,1
- 100,0
- 3,9
- 68,4
- 9,5
- 18,1
- 100,0
- 2,9
- 64,1
- 14,2
- 18,8
- 100,0
- 2,4
- 60,2
- 17,2
- 20,3
- 100,0
- 2,2
- 60,2
- 16,2
- 21,3
- 100,0
- 2,2
- 59,5
- 17,0
- 21,3
- 100,0
- 2,2
- 56,2
- 17,9
- 23,6
- 100,0
- 1,8
- 56,8
- 16,9
- 24,4
- 100,0
The electrical generation mix reveals that natural gas has a share of 37.7%, renewable energies 23.9% and nuclear 17.8% of electrical energy.
- Coal
- Oil Products
- Natural gas
- Hydroelectricity
- Nuclear
- Others (3)
- Where Wind:
- TOTAL
- 66.981
- 15.474
- 6.087
- 24.241
- 55.445
- 1.288
- n.d.
- 169.516
- 39,5
- 9,1
- 3,6
- 14,3
- 32,7
- 0,8
- --
- 100
- 80.524
- 21.869
- 21.808
- 31.806
- 62.206
- 6.943
- n.d.
- 225.156
- 35,8
- 9,7
- 9,7
- 14,1
- 27,6
- 3,1
- --
- 100
- 81.993
- 23.211
- 82.458
- 23.025
- 57.539
- 26.230
- 21.269
- 294.456
- 27,8
- 7,9
- 28,0
- 7,8
- 19,5
- 8,9
- 7,2
- 100
- 49.528
- 20.087
- 122.873
- 23.296
- 58.971
- 42.564
- 32.231
- 317.319
- 15,6
- 6,3
- 38,7
- 7,3
- 18,6
- 13,4
- 10,2
- 100
- 38.271
- 18.770
- 111.995
- 25.542
- 52.765
- 49.514
- 35.812
- 296.857
- 12,9
- 6,3
- 37,7
- 8,6
- 17,8
- 16,7
- 12,1
- 100
(2) Biomass, municipal waste, wind and solar fotovoltaic and thermal.
(3) Provisional data at 8/2/2010
Fuente: Secretaría de Estado de Energía. Ministerio de Indsutria, Turismo y Comercio.
These figures refer to total electrical output, including electricity produced and consumed by the producer itself, for example through co-generation.
All other renewable forms of electricity production have seen positive evolution, some registering substantial increases, a process which had already begun in previous years. For example, photovoltaic solar output amounted to 5328 GWh (an increase of 110% compared with 2008, when levels were in turn three times higher than in 2007), while wind power accounted for 35,812 GWh.
If we analyse the final destination of consumption, the transport sector was once again last year the biggest consumer of final energy, accounting for 38.9%. In second place was industry, with around 35%, and in third position sundry uses (around 27%), with household consumption being the most significant.
- INDUSTRY
- Coal
- Oil Products
- Natural gas
- Electricity
- TRANSPORT
- Coal
- Oil Products
- Natural gas
- Electricity
- SUNDRY USES
- Coal
- Oil Products
- Natural gas
- Electricity
- TOTAL by Final Energy
- Coal
- Oil Products
- Natural gas
- Electricity
- TOTAL by Sector
- INDUSTRY
- TRANSPORT
- SUNDRY USES
- 24.423
- 3.893
- 11.306
- 3.677
- 5.547
- 22.716
- 0
- 22.478
- 0
- 238
- 13.531
- 378
- 7.109
- 854
- 5.190
- 60.669
- 4.271
- 40.893
- 4.531
- 10.974
- 60.669
- 24.423
- 22.716
- 13.531
- 100,0
- 15,9
- 46,3
- 15,1
- 22,7
- 100,0
- 0,0
- 99,0
- 0,0
- 1,0
- 100,0
- 2,8
- 52,5
- 6,3
- 38,4
- 100,0
- 7,0
- 67,4
- 7,5
- 18,1
- 100,0
- 40,3
- 37,4
- 22,3
- 32.816
- 2.466
- 13.350
- 9.602
- 7.408
- 32.275
- 0
- 31.913
- 0
- 362
- 21.671
- 80
- 10.365
- 2.690
- 8.536
- 86.772
- 2.546
- 55.628
- 12.292
- 16.306
- 86.772
- 32.826
- 32.275
- 21.671
- 100,0
- 7,5
- 40,7
- 29,3
- 22,6
- 100,0
- 0,0
- 98,9
- 0,0
- 1,1
- 100,0
- 0,4
- 47,8
- 12,4
- 39,4
- 100,0
- 2,9
- 64,1
- 14,2
- 18,8
- 100,0
- 37,8
- 37,2
- 25,0
- 33.888
- 2.240
- 10.027
- 12.406
- 9.215
- 39.804
- 0
- 39.343
- 0
- 461
- 27.462
- 25
- 11.549
- 4.024
- 11.864
- 101.154
- 2.265
- 60.919
- 16.430
- 21.540
- 101.154
- 33.888
- 39.804
- 27.462
- 100,0
- 6,6
- 29,6
- 36,6
- 27,2
- 100,0
- 0,0
- 98,8
- 0,0
- 1,2
- 100,0
- 0,1
- 42,1
- 14,7
- 43,2
- 100,0
- 2,2
- 60,2
- 16,2
- 21,3
- 100,0
- 33,5
- 39,3
- 27,1
- 35.146
- 2.286
- 9.955
- 13.360
- 9.545
- 40.717
- 0
- 40.243
- 0
- 474
- 28.295
- 31
- 11.729
- 4.395
- 12.140
- 104.158
- 2.317
- 61.927
- 17.755
- 22.159
- 104.158
- 35.146
- 40.717
- 28.295
- 100,0
- 6,5
- 28,3
- 38,0
- 27,2
- 100,0
- 0,0
- 98,8
- 0,0
- 1,2
- 100,0
- 0,1
- 41,5
- 15,5
- 42,9
- 100,0
- 2,2
- 59,5
- 17,0
- 21,3
- 100,0
- 33,7
- 39,1
- 27,2
- 35.009
- 2.059
- 10.881
- 12.659
- 9.410
- 39.326
- 0
- 38.847
- 0
- 479
- 26.777
- 20
- 9.919
- 4.614
- 12.224
- 101.112
- 2.079
- 59.647
- 17.273
- 22.113
- 101.112
- 35.009
- 39.326
- 26.777
- 100,0
- 5,9
- 31,1
- 36,2
- 26,9
- 100,0
- 0,0
- 98,8
- 0,0
- 1,2
- 100,0
- 0,1
- 37,0
- 17,2
- 45,7
- 100,0
- 2,1
- 59,0
- 17,1
- 21,9
- 100,0
- 34,6
- 38,9
- 26,5
For example, if we assign an index of 100 to 1990, the figure for 2005 was 173. The following year the trend was reversed, with the graph taking a slight downward turn.
If we turn to final consumption in Spain in certain specific markets, and compare this with the same average consumption for the EU, we find that in the residential market energy consumption per inhabitant in the EU is 60% higher than the equivalent in Spain, a difference resulting from the milder Spanish winters.
- OF FINAL ENERGY
- Industry
- Transport
- Residential-Commercial
- IN R-C MARKET:
- Gasoil
- Natural gas
- Electricity
- In Domestic market
- 2.296
- 738
- 765
- 793
- 267
- 255
- 198
- 670
- 2.298
- 670
- 703
- 925
- 163
- 318
- 245
- 600
- 2.387
- 664
- 740
- 984
- 157
- 361
- 272
- 626
- 2.338
- 652
- 762
- 924
- 121
- 335
- 282
- 575
- 1.237
- 490
- 393
- 354
- 116
- 5
- 97
- 230
- 1.983
- 636
- 820
- 527
- 127
- 66
- 212
- 296
- 2.264
- 723
- 920
- 621
- 149
- 101
- 263
- 352
- 2.219
- 600
- 947
- 672
- 117
- 148
- 304
- 358
Over the next five years the capacity for electoral interconnections between Portugal and Spain will be doubled, thanks to 5 new connection points. In the case of Morocco there is also considerable co-operation, with the connection with Spain capable of covering 20% of the North African country's demand. Work is ongoing with France on a new connection which should be ready by 2013, doubling the current (limited) capacity. It should be remembered that no new interconnection with France has been opened since 1982.
In January 2009 the European Commission made public the adoption of a plan focusing on economic recovery. The provision for Spain was for more than 300 million euros for energy projects. These include the CIUDEN innovation and demonstration project for CO2 capture and storage, in Compostilla, in Leon province. In December 2009 the Commission gave the definitive go-ahead for an investment of € 1.5 billion in CO2 capture and storage and marine wind energy projects. Of this funding, 180 million corresponds to the Endesa-CIUDEN project.