

The advance official numbers suggest a total primary energy consumption in Spain of 130.5 million tonnes of oil equivalent (Toe).
If we take out of the equation energy not commercially sold (for example biomass consumed by households), consumption of primary energy would stand at around 125.9 million Toe.
- Coal
- Oil
- Natural gas
- Nuclear
- Renewable Energy
- -Hydraulic
- -Wind
- -Biomass and waste
- -Biofuels
- -Geothermal
- -Solar
- Elect. Balance (Im-Ex)
- TOTAL
- 18.477
- 70.759
- 30.298
- 15.669
- 9.602
- 2.200
- 2.012
- 5.123
- 171
- 8
- 88
- -282
- 144.523
- 12,8
- 49,0
- 21,0
- 10,8
- 6,6
- 1,5
- 1,4
- 3,5
- 0,1
- 0,0
- 0,1
- -0,2
- 100,0
- 20.354
- 70.848
- 31.602
- 14.360
- 9.967
- 2.342
- 2.387
- 4.708
- 386
- 8
- 136
- -495
- 146.636
- 13,9
- 48,3
- 21,6
- 9,8
- 6,8
- 1,6
- 1,6
- 3,2
- 0,3
- 0,0
- 0,1
- -0,3
- 100,0
- 13.916
- 68.107
- 34.783
- 15.368
- 10.622
- 2.004
- 2.772
- 4.886
- 601
- 8
- 351
- -949
- 141.847
- 9,8
- 48,0
- 24,5
- 10,8
- 7,5
- 1,4
- 2,0
- 3,4
- 0,4
- 0,0
- 0,2
- -0,7
- 100,0
- 10.337
- 64.225
- 31.078
- 13.751
- 11.795
- 2.197
- 3.080
- 4.832
- 1.044
- 9
- 633
- -722
- 130.464
- 7,9
- 49,2
- 23,8
- 10,5
- 9,0
- 1,7
- 2,4
- 3,7
- 0,8
- 0,0
- 0,5
- -0,6
- 100,0
Mini-hydraulic is included in hydraulic.
Source: Secretaría de Estado de Energía. Ministerio de Industria, Turismo y Comercio.
- Coal (2)
- Oil
- Natural gas
- Hyd.+Wind+Solar (4)
- Nuclear
- Electric Bal. (Im-Ex)
- TOTAL
- 18.974
- 47.741
- 5.000
- 2.205
- 14.138
- -36
- 88.022
- 18.721
- 54.610
- 7.504
- 2.000
- 14.449
- 386
- 97.670
- 22.137
- 64.663
- 15.223
- 2.943
- 16.211
- 382
- 121.559
- 22.514
- 71.765
- 29.120
- 3.527
- 14.995
- -116
- 141.805
- 19.849
- 70.759
- 30.298
- 4.227
- 15.669
- -282
- 140.520
- 21.865
- 70.848
- 31.602
- 4.703
- 14.360
- -495
- 142.963
- 15.578
- 68.110
- 34.783
- 5.023
- 15.368
- -949
- 137.913
- 11.827
- 64.225
- 31.078
- 5.754
- 13.751
- -722
- 125.913
(2) Including waste and others in electric generation.
(3) Provisional data at 8.2.2010
(4) And photovoltaic solar.
Source: Secretaría de Estado de Energía. Ministerio de Industria, Turismo y Comercio.
As a result of this situation, there was a continued increase in energy efficiency, a trend which began in 2005.
The evolution of the specific consumption of each primary energy source was as follows:
There was a drop in the demand for coal (-24.1%), natural gas (-10.5%), nuclear (-10.5%) and oil (-5.7%), and an increase in output from renewable energies (+11%), and hence their consumption.
- Coal
- Oil
- Natural gas
- Water+Wind+Solar
- Nuclear
- TOTAL
- -8,7
- 3,2
- 7,8
- 40,3
- 2,4
- 2,3
- 12,1
- 1,4
- 14,3
- -31,7
- -1,1
- 3,5
- -5,3
- 2,5
- 13,3
- 62,3
- -1,8
- 3,2
- 5,0
- 2,5
- 16,1
- -10,0
- 2,8
- 4,4
- 2,4
- 1,0
- 18,0
- -14,8
- -9,5
- 2,6
- -11,8
- -1,4
- 4,0
- 19,8
- 4,5
- -0,9
- 10,2
- 0,1
- 4,3
- 13,2
- -8,4
- 1,7
- -8,8
- -3,9
- 10,1
- 5,0
- 7,0
- -3,5
- -24,1
- -5,7
- -10,5
- 14,6
- -10,5
- -8,7
- Coal
- Oil
- Natural gas
- Water+Wind+Solar
- Nuclear
- Electrical Balance (Im-Ex)
- TOTAL
- 21,6
- 54,2
- 5,7
- 2,5
- 16,1
- 0,0
- 100,0
- 19,2
- 55,9
- 7,7
- 2,0
- 14,8
- 0,4
- 100,0
- 18,2
- 53,2
- 12,5
- 2,4
- 13,3
- 0,3
- 100,0
- 15,9
- 50,6
- 20,5
- 2,5
- 10,6
- -0,1
- 100,0
- 14,1
- 50,4
- 21,6
- 3,0
- 11,2
- -0,2
- 100,0
- 15,3
- 49,6
- 22,1
- 3,3
- 10,0
- -0,3
- 100,0
- 11,3
- 49,4
- 25,2
- 3,6
- 11,1
- -0,7
- 100,0
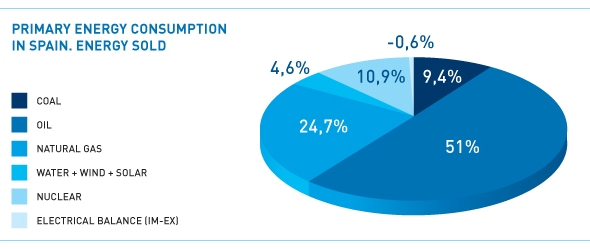
- 9,4
- 51,0
- 24,7
- 4,6
- 10,9
- -0,6
- 100,0

Demand for coal has been on a downward trend since early 2008, the year when prices increased on a par with the price of crude. In 2009 coal was affected by a reduction in thermal electrical generation as a result of the increase in the proportion which renewable energies make up of the generation mix.
Although Spanish coal output has been declining for more than 20 years (the peak in recent history came in 1983, at a level of close on 40 million tonnes), with figures over recent years of around 10 million tonnes, temporary misalignments with the price of imported coal and/or natural gas have led to surplus output.
The decrease in the termal gap is heightened by the downturn in demand. For example, in November electrical generation by wind power was 38% up on the previous month, while demand for electricity dropped by 6.2%, temperatures being relatively milder than in 2008.
This reduction in the thermal gap has also affected natural gas. In 2008 use in generation accounted for 41.8% of all natural gas demand, the figure dropping to 40.1% in 2009. The reduction has also been affected by the positive performance of renewable energies. There was a considerable upturn in 2009 in output from wind power and hydroelectric.
During the first three months of 2009 hydroelectric output rose by 124%, representing the equivalent of 50% of electrical output from natural gas combined cycle plants over the same period. It was, however, a year of constant hydroelectrical output as a result of the accumulated bodies of water and the rains in the early months of the year (in April cumulative water reserves stood at 54.4%), along with December, with a total cumulative increase of 11.5%.
On the last day of 2009 water reserves stood at 50% of capacity, five points higher than at the close of 2008. In parallel, the summer of 2009 was the third-hottest since 1970.
Oil maintains a share of around 50% of primary energy, coal (without solid urban waste) has seen its market share fall by almost 2 points, contributing 7.9% of primary energy. Two years ago the level was 13.9%.
The provisional CORES figures suggest a downturn of 5.3% in demand for diesel within the oil products segment. The final cumulative CORES data up to November indicate a 9.3% drop in demand for kerosene, and 6.1% for LPG. These are striking figures, in particular for diesel (bearing in mind the growing proportion which diesel-powered vehicles represent out of the car stock in Spain), and kerosene, as a result of the downturn in air travel.
The increase of 2459 MW of installed wind power in 2009 is one of the highest of recent years. However, the forecast for 2010 is for 1000 MW to come on-stream, the lowest figure since the year 2000.
By the end of 2009 there were 860 MW of thermal solar power installed, a figure likewise above the forecasts set out in the 2005-2010 Renewable Energies Plan.
In the field of photovoltaic energy Spain is now towards the top of the world league table in terms of installed power, in particular as a result of the efforts made in 2008, with 2660 MW being installed during that year. The demand for the creation of new facilities exceeded government forecasts in 2008. As a result, the government cut back on its policy of grants by passing Royal Decree 1578/2008, leading to a freeze in the market for more than six months. Installed power now amounts to over 3500 MW.
In 2009 the credit crunch, the reduction in premiums in October 2008 and the ongoing reduction in the price of solar panels (leading investors to delay their investment decisions) were all factors which led to a substantial downturn in investments, with only around 120 MW being installed in 2009. The government's current plans involve in awarding licences for the installation of 500 MW per year.
By December 2009 the Ministry of Industry, Tourism and Trade had registered 338 facilities, representing a total registered power rating of 6389 MW of wind power and 2340 MW of thermo-electric solar technology. These figures are in excess of the targets for the 2005-2010 Renewable Energies Plan. Registration for the pre-allocation of remuneration is an essential condition for facilities to receive public grants.
Spain remains the world's third-largest producer of wind power, and is on the way to achieving the target of 20,155 megawatts installed by 2010, as set out in the Spanish government's Renewable Energies Plan.
One novel feature is the capacity to remain one step ahead of the possible impact of sudden losses of wind power generation as a result of the effect of voltage gaps. Other actions in this regard involve an increase in the capacity for overflow from the electrical system to neighbouring countries or an increase in pumping capacity.
January 2009 saw the 11,000 MWh mark for instantaneous wind power generation surpassed for the first time, while more than 11,200 MWh were generated in early March, with closed on 30% of mainland electrical demand being covered at 11 o'clock. On 8 November 2007 total instantaneous generation reached 11,620 MW.
Meanwhile, senior figures at the Ministry of Industry, Tourism and Trade (the 'MITyC')have announced their aim to install up to 5000 MW of offshore wind power by 2030.
On 24 July the Ministry published its Wind Atlas of Spain, which will allow agents in the sector, and the general public, to assess initial wind power potential available throughout the country and along the coastal belt.
In mid-May the first commercial thermoelectric solar energy plant in Europe using parabolic cylinders and with no accumulation opened in Puertollano, in Ciudad Real province. The plant is owned by Iberdrola Renovables and the MITyC, through the IDAE (Alternative Energy Development Institute). It has a power rating of 50 MW.
Spain is Europe's leader in thermoelectric technology, with the aim of having 730 MW installed by the close of 2010, a figure which would surpass the targets set out in the 2005-2010 Renewable Energies Plan.
- Coal
- Oil
- Natural gas
- TOTAL (3)
- 67,5
- 5,5
- 13,0
- 35,9
- 60,7
- 1,7
- 24,6
- 34,0
- 53,1
- 1,2
- 7,2
- 28,2
- 40,0
- 0,3
- 1,0
- 23,3
- 36,4
- 0,4
- 1,3
- 21,2
- 35,3
- 0,2
- 0,5
- 21,1
- 33,8
- 0,2
- 0,2
- 21,7
- 28,8
- 0,2
- 0,0
- 20,7
- 31,4
- 0,2
- 0,0
- 21,5
- 37,2
- 0,1
- 0,0
- 22,6
(2) Provisional data at 8/2/2010
(3) Out of the Total, including nuclear, hydraulic and other renewable energy sources, with 100% Spanish supply allocation.
Source: Secretaría de Estado de Energía.
Ministerio de Industria, Turismo y Comercio.
- Coal
- Oil
- Natural gas
- Nuclear
- Renewable Energy
- TOTAL
- 6.626
- 166
- 144
- 14.995
- 8.876
- 30.807
- 21,5
- 0,5
- 0,5
- 48,7
- 28,8
- 100,0
- 6.242
- 140
- 55
- 15.669
- 9.211
- 31.317
- 19,9
- 0,4
- 0,2
- 50,0
- 29,4
- 100,0
- 5.865
- 143
- 16
- 14.360
- 9.966
- 30.350
- 19,3
- 0,5
- 0,1
- 47,3
- 32,8
- 100,0
- 4.374
- 127
- 14
- 15.368
- 10.623
- 30.506
- 14,3
- 0,4
- 0,0
- 50,4
- 34,8
- 100,0
- 3.849
- 95
- 13
- 13.751
- 11.795
- 29.503
- 13,0
- 0,3
- 0,0
- 46,6
- 40,0
- 100,0
Source: Secretaría de Estado de Energía.
Ministerio de Industria, Turismo y Comercio.
Measures to open up the marketplace, the development of electrical and gas infrastructure and interconnections, support for renewables and energy savings and efficiency in all sectors of consumption are among the instruments being developed in order to meet targets.
Improvements in infrastructure include the construction and expansion of the Mediterranean gas and electricity ring, along with the promotion of energy corridors in the south-west of Europe (Spain-France connections).
The proposed Model for the Organisation and Operational Principles of the Iberian Gas Market ('MIBGAS'), drawn up by the Portuguese and Spanish regulators (the ERSE and CNE, respectively) in 2008 called for an action plan covering the implementation of a comparative study of the conditions in order to obtain a marketing licence in the two countries, and a proposal for harmonisation. A consultation document has been drawn up, with a proposal for mutual acknowledgement of gas marketing licences in both countries, a proposal which has been put before the respective governments.
Certain controversial issues have arisen in the field of energy. Most public and private electrical and gas sector agents have indicated it would be a mistake to halt investment in infrastructure. Last year was also marked by the fierce debate as to nuclear energy. The government's decision to grant a partial extension only up until 2013 for the Garoña nuclear power plant has aroused controversy among defendants and opponents of the energy source.
- OF PRIMARY ENERGY
- 3.461
- 3.550
- 3.718
- 3.649
- 1.924
- 3.064
- 3.360
- 3.301

-
 ENDESA
 -
 MEDGAZ
 -
 NATURGAS