

Gas in Spain
>
Demand for natural gas
>
Significant data
Significant data
A number of factors caused the amount of natural gas consumed in Spain in 2008 to rise to a total of 38.6 bcm.
SALES OF NATURAL GAS
(GWh)
- MARKET
- 1. RESIDENTIAL-COMMERCIAL
- Natural gas
- Gas manufactured from NG
- 1.1 Subtotal natural gas
- Gas manufactured from naphtha
- Propane-air mix
- 1.2. Subtotal other gases
- 2. INDUSTRIAL
- 3. ELECTRICITY PLANTS
- 4. NON-ENERGY USE
- 5. TOTAL NATURAL GAS (1.1+2+3+4)
- TOTAL (1.2+5)
- TOTAL Sales of natural gas (bcm)
1990
- 10.771
- 7.578
- 2.604
- 10.182
- 523
- 66
- 589
- 44.166
- 2.254
- 4.835
- 61.438
- 62.026
- 5,3
1995
- 18.101
- 17.040
- 729
- 17.769
- 272
- 60
- 332
- 69.381
- 879
- 6.196
- 94.225
- 94.557
- 8,1
2000
- 34.755
- 34.221
- 31
- 34.253
- 0
- 502
- 502
- 144.994
- 10.379
- 6.131
- 195.756
- 196.258
- 16,8
2005
- 56.425
- 55.856
- 0
- 55.856
- 0
- 568
- 568
- 202.278
- 111.320
- 6.199
- 375.653
- 376.221
- 32,3
2007
- 56.785
- 56.231
- 0
- 56.231
- 0
- 554
- 554
- 203.391
- 142.057
- 6.158
- 407.837
- 408.391
- 35,1
2008
- 59.617
- 59.044
- 0
- 59.044
- 0
- 573
- 573
- 197.256
- 187.534
- 5.033
- 448.868
- 449.441
- 38,6
Source: Sedigas
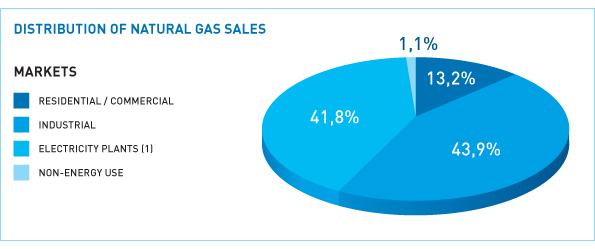
DISTRIBUTION OF NATURAL GAS SALES IN PERCENTAGE TERMS
- MARKET
- RESIDENTIAL-COMMERCIAL
- INDUSTRIAL
- ELECTRICITY PLANTS (1)
- NON-ENERGY USES
- TOTAL
1985
- 16,1
- 57,6
- 25,6
- 0,6
- 100,0
1990
- 16,6
- 71,9
- 3,7
- 7,9
- 100,0
1995
- 18,9
- 73,6
- 0,9
- 6,6
- 100,0
2000
- 17,5
- 74,1
- 5,3
- 3,1
- 100,0
2004
- 16,1
- 61,4
- 20,7
- 1,8
- 100,0
2005
- 14,9
- 53,8
- 29,6
- 1,7
- 100,0
2006
- 13,2
- 50,9
- 34,4
- 1,5
- 100,0
2007
- 13,8
- 49,9
- 34,8
- 1,5
- 100,0
2008
- 13,2
- 43,9
- 41,8
- 1,1
- 100,0
(1) This does not include sales for the generation of electricity by cogeneration, which is included under the relevant market.
Yearly variation rate of natural gas in Spain.
- MARKET
- 1. RESIDENTIAL-COMMERCIAL
- Natural gas
- Gas manufactured from NG
- 1.1 Subtotal natural gas
- Gas manufactured from naphtha
- Propane-air mix
- 1.2. Subtotal other gases
- 2. INDUSTRIAL
- 3. ELECTRICITY PLANTS
- 4. NON-ENERGY USES
- 5. TOTAL NATURAL GAS (1.1+2+3+4)
- TOTAL (1.2+5)
1999
- 20,3
- 21,0
- -46,2
- 20,7
- -60,6
- 22,4
- -8,8
- 15,7
- 6,5
- -10,4
- 15,0
- 14,9
2000
- 7,4
- 7,2
- -48,9
- 7,1
- -100,0
- 52,0
- 27,3
- 12,6
- 35,2
- 0,5
- 12,1
- 12,2
2001
- 16,7
- 17,4
- -94,4
- 17,3
- --
- -24,3
- -24,3
- 5,5
- 22,7
- -0,7
- 8,3
- 8,2
2002
- 7,0
- 6,6
- -100,0
- 6,6
- --
- 41,1
- 41,1
- 9,2
- 115,0
- -5,5
- 14,7
- 14,7
2003
- 10,1
- 10,4
- --
- 10,4
- --
- -15,3
- -15,3
- 9,0
- 46,3
- 5,8
- 13,3
- 13,3
2004
- 8,9
- 8,8
- --
- 8,8
- --
- 9,8
- 9,8
- 7,8
- 65,0
- -6,6
- 16,0
- 16,0
2005
- 8,5
- 8,5
- --
- 8,5
- --
- 13,7
- 13,7
- 3,1
- 68,4
- 9,0
- 17,6
- 17,6
2006
- -7,9
- -7,8
- --
- -7,8
- --
- -11,8
- -11,8
- -1,5
- 21,0
- -8,1
- 4,1
- 4,1
2007
- 9,2
- 9,2
- --
- 9,2
- --
- 10,6
- 10,6
- 2,1
- 5,5
- 8,1
- 4,3
- 4,3
2008
- 5,0
- 5,0
- ----
- 5,0
- ----
- 3,4
- 3,4
- -3,0
- 32,0
- -18,3
- 10,1
- 10,1


Annual Report 2.008: Sedigas - The Spanish Gas Association