

Estimates of worldwide energy consumption stood at some 11.32 million Tep, up by slightly less than 2% on 2007, which in turn recorded a rise of 3 tenths of a point less than for the previous twelve months.
Natural gas maintained a share of very nearly 24% of total primary energy consumption worldwide, while coal increased its share in both absolute and relative terms, though by less than it had done during 2007. Oil accounts for a little over 35% of the world’s energy needs and remains in first position as a primary energy source, though the trend is still downwards.
- Coal
- Oil
- Natural gas
- Nuclear (3)
- Hydroelectricity(4)
- WORLD TOTAL
- OECD
- 2.768,1
- 3.823,7
- 2.427,6
- 625,4
- 644,7
- 10.289,5
- 5.519,2
- 26,9
- 37,2
- 23,6
- 6,1
- 6,3
- 100,0
- 53,6
- 2.892,4
- 3.871,0
- 2.496,8
- 627,0
- 670,4
- 10.557,6
- 5.556,3
- 27,4
- 36,7
- 23,6
- 5,9
- 6,3
- 100,0
- 52,6
- 3.041,7
- 3.910,9
- 2.558,3
- 634,9
- 697,2
- 10.843,0
- 5.552,4
- 28,1
- 36,1
- 23,6
- 5,9
- 6,4
- 100,0
- 51,2
- 3.177,5
- 3.952,8
- 2.637,7
- 622,0
- 709,2
- 11.099,2
- 5.566,4
- 28,6
- 35,6
- 23,8
- 5,6
- 6,4
- 100,0
- 50,2
- 3.272,8
- 3.996
- 2.703,6
- 630,0
- 715,0
- 11.317,7
- 5.555,3
- 28,9
- 35,3
- 23,9
- 5,6
- 6,3
- 100,0
- 49,1
(2) Estimate
(3) (4) Calculation methodology modified by BP from its June 2002 report onwards. The new methodology (applied to every year of the series) assumes a value for nuclear and hydroelectric primary energy in terms equivalent to the energy required to generate the same quantity of electricity at a conventional power station, assuming a conversion efficiency of 38%.
Previously hydroelectric generation was considered as primary energy equivalent to the electricity produced, while for nuclear energy the efficiency factor used in the conversion was 33%.
One of the consequences of this change in a methodology is an increase in the total consumption of primary energy in every area and a reduction of the relative weighting of other energy sources, including natural gas.
This new methodology employed by BP is not used by Eurostat or the IEA, which, for hydroelectric and nuclear power, equate energy output at terminals to primary energy.
Source: BP Statistical Review of World Energy, Monthly Natural Gas Survey (IEA), Monthly Oil Survey (IEA) and prepared by Sedigas.
Within the European Union, official data from the European Commission indicated a slight fall in total energy consumption during 2007, following the stagnation recorded in 2006 in respect of 2005.
Estimates for 2008 are that the EU will experience a rise in consumption of around 0.6%, with natural gas attaining a share of around 24%.
- North America
- USA
- Canada
- Central and Sur America
- Argentina
- Brazil
- Mexico
- Venezuela
- Chile
- Colombia
- Europe
- Germany
- Austria
- Belgium and Luxembourg
- Bulgaria
- Denmark
- Spain
- Finland
- France
- Greece
- Ireland
- Italy
- Netherlands
- Poland
- Portugal
- United Kingdom
- Czech Republic
- Romania
- Sweden
- Soviet Union
- Russian Fed.
- Ukraine
- Middle East
- Iran
- Saudi Arabia
- Kuwait
- Unión de Emiratos Árabes
- Africa
- South Africa
- Egypt
- Argelia
- Asia-Oceania
- Australia
- South Korea
- China
- India
- Japan
- Indonesia
- TOTAL WORLD
- OCDE
- 39,0
- 39,9
- 31,8
- 48,2
- 31,9
- 44,5
- 57,3
- 37,3
- 55,7
- 34,4
- 39,2
- 36,2
- 41,4
- 56,1
- 26,5
- 51,4
- 50,9
- 38,5
- 35,8
- 63,5
- 62,3
- 46,4
- 53,0
- 25,7
- 60,3
- 36,2
- 22,9
- 27,2
- 33,5
- 17,8
- 18,2
- 11,3
- 51,1
- 42,1
- 59,2
- 55,3
- 36,1
- 40,1
- 20,2
- 48,4
- 34,5
- 31,2
- 34,7
- 46,0
- 19,7
- 31,8
- 44,2
- 47,5
- 35,6
- 40,4
- 25,4
- 25,2
- 26,3
- 24,0
- 53,9
- 9,1
- 31,3
- 35,7
- 13,9
- 23,1
- 24,1
- 24,0
- 24,5
- 20,7
- 13,7
- 22,7
- 22,8
- 13,5
- 14,8
- 10,6
- 28,5
- 39,0
- 36,5
- 13,0
- 16,3
- 38,1
- 18,5
- 37,0
- 1,8
- 54,9
- 57,1
- 42,8
- 46,9
- 55,1
- 40,8
- 44,7
- 63,9
- 21,8
- 0,0
- 45,6
- 63,2
- 10,6
- 18,6
- 14,2
- 3,3
- 9,0
- 15,7
- 26,5
- 23,8
- 23,7
- 22,5
- 24,3
- 9,4
- 4,5
- 0,5
- 6,3
- 5,9
- 0,6
- 11,5
- 8,7
- 18,8
- 27,7
- 9,8
- 7,6
- 39,7
- 26,0
- 14,4
- 16,7
- 4,7
- 23,8
- 7,3
- 9,7
- 9,6
- 60,5
- 13,8
- 18,2
- 43,6
- 22,7
- 4,4
- 16,1
- 13,7
- 28,9
- 1,1
- 0,6
- 0,0
- 0,0
- 0,0
- 30,7
- 76,5
- 1,4
- 2,0
- 49,9
- 43,6
- 25,5
- 70,4
- 51,4
- 24,2
- 24,3
- 28,6
- 21,3
- 7,9
- 8,1
- 6,6
- 1,0
- 2,2
- 1,3
- 1,5
- 0,0
- 0,0
- 0,0
- 11,0
- 10,2
- 0,0
- 14,8
- 16,2
- 0,0
- 10,3
- 19,6
- 39,1
- 0,0
- 0,0
- 0,0
- 0,9
- 0,0
- 0,0
- 6,5
- 13,6
- 4,0
- 30,5
- 5,8
- 5,2
- 15,4
- 0,0
- 0,0
- 0,0
- 0,0
- 0,0
- 0,9
- 2,3
- 0,0
- 0,0
- 3,2
- 0,0
- 13,8
- 0,8
- 1,0
- 12,2
- 0,0
- 5,6
- 9,4
- 5,2
- 2,4
- 25,9
- 22,5
- 11,5
- 38,8
- 3,9
- 26,5
- 18,8
- 33,8
- 6,8
- 2,0
- 24,2
- 0,8
- 3,9
- 0,0
- 1,6
- 11,6
- 5,6
- 2,1
- 2,0
- 4,9
- 0,0
- 0,7
- 9,6
- 1,0
- 1,4
- 9,1
- 29,9
- 5,5
- 5,9
- 1,7
- 0,9
- 2,2
- 0,0
- 0,0
- 0,0
- 6,4
- 0,9
- 4,6
- 0,3
- 5,1
- 3,1
- 0,5
- 5,9
- 6,8
- 3,7
- 1,7
- 6,4
- 5,3
- 100,0
- 100,0
- 100,0
- 100,0
- 100,0
- 100,0
- 100,0
- 100,0
- 100,0
- 100,0
- 100,0
- 100,0
- 100,0
- 100,0
- 100,0
- 100,0
- 100,0
- 100,0
- 100,0
- 100,0
- 100,0
- 100,0
- 100,0
- 100,0
- 100,0
- 100,0
- 100,0
- 100,0
- 100,0
- 100,0
- 100,0
- 100,0
- 100,0
- 100,0
- 100,0
- 100,0
- 100,0
- 100,0
- 100,0
- 100,0
- 100,0
- 100,0
- 100,0
- 100,0
- 100,0
- 100,0
- 100,0
- 100,0
- 100,0
- 100,0
- 2.683,1
- 2.361,4
- 321,7
- 708,6
- 73,7
- 216,8
- 155,6
- 71,8
- 28,7
- 29,9
- 1.952,3
- 311,0
- 32,6
- 73,5
- 20,4
- 18,1
- 140,2
- 27,5
- 255,1
- 34,0
- 15,1
- 179,6
- 91,5
- 94,4
- 23,9
- 215,9
- 43,3
- 39,7
- 50,2
- 1.035,1
- 692,0
- 136,0
- 573,9
- 182,9
- 167,6
- 25,3
- 60,9
- 344,5
- 127,7
- 63,2
- 34,8
- 3.801,7
- 121,7
- 234,0
- 1.863,5
- 404,4
- 517,4
- 114,6
- 11.099,2
- 5.566,4
It was wind energy that formed the focus of most activity in the European Union during 2008. Worldwide, installed capacity rose by 28.8% to a total of 120.8 GW, and some countries recorded significant advances. China, for example, now has a total of 12.2 GW of wind production installed, having doubled its capacity over the last twelve months.
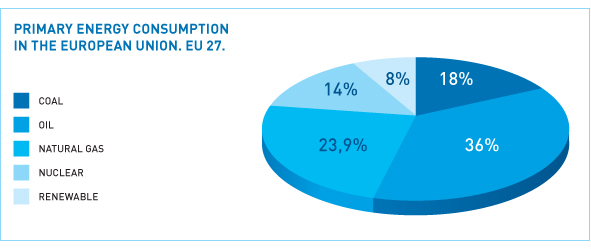
- Coal
- Oil
- Natural gas
- Nuclear
- Renewable
- TOTAL
- 329,9
- 676,7
- 435,7
- 260,1
- 116,2
- 1.818,6
- 18,1
- 37,2
- 24,0
- 14,3
- 6,4
- 100,0
- 319,9
- 677,0
- 446,2
- 257,4
- 120,6
- 1.821,1
- 17,6
- 37,2
- 24,5
- 14,1
- 6,6
- 100,0
- 325,2
- 673,5
- 437,9
- 255,3
- 129,2
- 1.821,1
- 17,9
- 37,0
- 24,0
- 14,0
- 7,1
- 100,0
- 327,3
- 672,0
- 429,2
- 256,0
- 134,1
- 1.818,6
- 18,0
- 37,0
- 23,6
- 14,1
- 7,4
- 100,0
- 329,4
- 658,6
- 438,2
- 256,7
- 147,0
- 1.829,9
- 18,0
- 36,0
- 23,9
- 14,0
- 8,0
- 100,0
(2) Estimate.
Source: Energy Yearly Statistics 2006 and Energy Monthly Statistics. Eurostat. European Commission. Luxembourg. 2008; Eurogas; Monthy Oil Survey (AIE) and prepared by Sedigas.
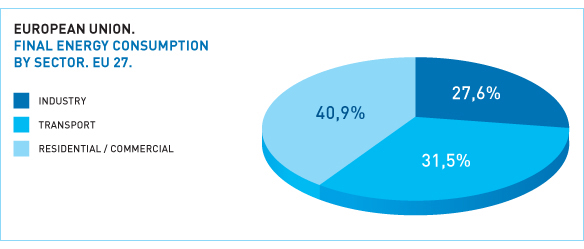
- Industry
- Transport
- Residential-Commerc.
- TOTAL
- 326,3
- 346,0
- 454,0
- 1.126,3
- 29,0
- 30,7
- 40,3
- 100,0
- 332,0
- 351,3
- 474,8
- 1.158,1
- 28,7
- 30,3
- 41,0
- 100,0
- 332,5
- 359,8
- 479,2
- 1.171,5
- 28,4
- 30,7
- 40,9
- 100,0
- 325,6
- 362,4
- 484,3
- 1.172,3
- 27,8
- 30,9
- 41,3
- 100,0
- 324,3
- 370,3
- 481,5
- 1.176,1
- 27,6
- 31,5
- 40,9
- 100,0
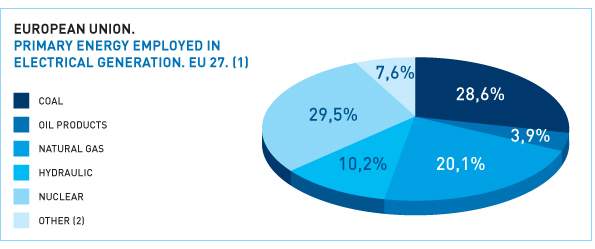
- Coal
- Oil Products
- Natural gas
- Hydraulic
- Nuclear
- Other (2)
- Where wind:
- TOTAL
- 1.003.041
- 162.980
- 566.819
- 338.307
- 995.860
- 149.025
- 44.370
- 3.216.032
- 31,2
- 5,1
- 17,6
- 10,5
- 31,0
- 4,6
- - -
- 100,0
- 982.375
- 146.180
- 616.050
- 357.148
- 1.008.437
- 177.381
- 58.815
- 3.287.571
- 29,9
- 4,4
- 18,7
- 10,9
- 30,7
- 5,4
- - -
- 100,0
- 941.551
- 138.919
- 660.869
- 341.388
- 997.699
- 228.680
- 70.486
- 3.309.106
- 28,5
- 4,2
- 20,0
- 10,3
- 30,2
- 6,9
- - -
- 100,0
- 961.701
- 131.089
- 676.541
- 343.990
- 989.877
- 254.760
- 81.960
- 3.357.958
- 28,6
- 3,9
- 20,1
- 10,2
- 29,5
- 7,6
- - -
- 100,0
(2) Wind, solar, geothermal, derivative gases, biomass and urban and industrial waste.
Source: Energy Yearly Statistics 2006. Eurostat. European Commission.. Luxembourg. 2008. Prepared by Sedigas.

-
 Unión Fenosa Gas
 -
 Medgaz
 -
 Unión Fenosa Gas