

- Coal
- Oil
- Natural gas
- Nuclear
- Renewable Energy
- -Hydraulic
- -Wind
- -Biomass and waste
- -Biofuels
- -Geothermal
- -Solar
- Elect. Balance (Im-Ex)
- TOTAL
- 18.477
- 70.759
- 30.298
- 15.669
- 9.211
- 2.200
- 2.012
- 4.732
- 171
- 8
- 88
- -282
- 144.132
- 12,8
- 49,1
- 21,0
- 10,9
- 6,4
- 1,5
- 1,4
- 3,3
- 0,1
- 0,0
- 0,1
- -0,2
- 100,0
- 20.236
- 70.848
- 31.602
- 14.360
- 10.228
- 2.341
- 2.368
- 4.994
- 382
- 8
- 135
- -495
- 146.779
- 13,8
- 48,3
- 21,5
- 9,8
- 7,0
- 1,6
- 1,6
- 3,4
- 0,3
- 0,0
- 0,1
- -0,3
- 100,0
- 14.591
- 68.511
- 34.798
- 15.372
- 10.731
- 1.901
- 2.678
- 5.223
- 650
- 8
- 271
- -949
- 143.054
- 10,2
- 47,9
- 24,3
- 10,7
- 7,5
- 1,3
- 1,9
- 3,7
- 0,5
- 0,0
- 0,2
- -0,7
- 100,0
Mini-hydraulic is included in hydraulic.
Source: Secretaría General de la Energía. Ministerio de Industria, Turismo y Comercio.
This development indicates an improvement in energy efficiency over the last year, as it shows a fall in energy consumption per unit of Gross Domestic Product.
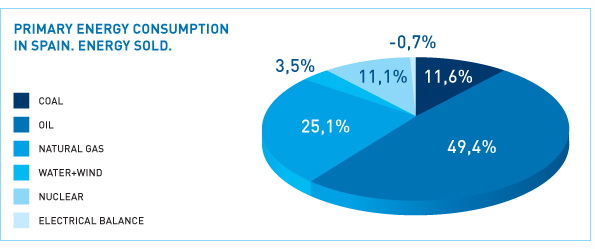
The same had already happened in 2006 (when a fall in total consumption of 0.9% was recorded), though while then it was due to a significant increase in hydro-electricity production (which is entered on the primary energy balance sheet with a yield of 100%), the fall during 2008 can be put down to increased energy prices to the end user and falling business levels in sectors that are energy-intensive, such as industrial businesses relating to the construction sector.
- Coal
- Oil
- Natural gas
- Water+Wind
- Nuclear
- Elect. Balance (Im-Ex)
- TOTAL
- 19.121
- 39.538
- 2.195
- 2.701
- 7.308
- -92
- 70.771
- 18.974
- 47.741
- 5.000
- 2.205
- 14.138
- -36
- 88.022
- 18.721
- 54.610
- 7.504
- 2.000
- 14.449
- 386
- 97.670
- 22.137
- 64.663
- 15.223
- 2.943
- 16.211
- 382
- 121.559
- 22.514
- 71.765
- 29.120
- 3.527
- 14.995
- -116
- 141.805
- 19.849
- 70.759
- 30.298
- 4.227
- 15.669
- -282
- 140.520
- 21.649
- 70.848
- 31.602
- 4.844
- 14.360
- -495
- 142.808
- 16.149
- 68.511
- 34.798
- 4.850
- 15.372
- -949
- 138.731
The sharp fall in demand for coal is closely linked to the increase in international prices, which made it less attractive for use in electricity generation. The rising cost of coal mirrored developments in the international crude oil market during the first eight months of the year. At the same time, natural gas became a more attractive proposition for use in combined cycle plants, a position that was further strengthened by the sufficiency of supply in the short-term international markets. The reason for this was that the USA had a healthy local supply and notably reduced its reliance on imports.
We have already mentioned that one of the reasons for the fall in oil consumption in Spain was the increased price. Thus, demand for diesel fell by 10.1% in June, the month in which the highest prices were recorded. According to data from CORES, demand in 2008 as a whole fell on average by 3.9%, after steadily rising in recent years as the number of diesel-powered vehicles on the road increased. Demand for liquefied petroleum gas (LPG) fell by the same percentage, while petrol fell by 6%.
The increase in nuclear production in 2008 was a relative one, rising at a slightly lower rate than in 2006. The positive upturn last year as compared with the previous twelve months resulted from the fact that some reactors remained shut down for maintenance for longer than was planned in 2007.
Spain has thus strengthened its position as the third largest producer of wind power in the world, and remains on course to achieve its target of 20,155 MW of installed potential by 2010, as set out in the Spanish Government’s Renewable Energy Plan.
The closing months of 2008 demonstrated the strength of this form of electricity generation, with energy levels in excess of 10,000 MWh being exceeded on several occasions. At the end of January 2009, a figure of 11,159 MWh was reached, a record for the generation of instant wind energy to date.
- Coal
- Oil
- Natural gas
- Water+Wind
- Nuclear
- Elect. Balance (Im-Ex)
- TOTAL
- 19,4
- 72,8
- 2,3
- 3,7
- 2,0
- -0,2
- 100,0
- 27,0
- 55,9
- 3,1
- 3,8
- 10,3
- -0,1
- 100,0
- 21,6
- 54,2
- 5,7
- 2,5
- 16,1
- 0,0
- 100,0
- 19,2
- 55,9
- 7,7
- 2,0
- 14,8
- 0,4
- 100,0
- 18,2
- 53,2
- 12,5
- 2,4
- 13,3
- 0,3
- 100,0
- 15,9
- 50,6
- 20,5
- 2,5
- 10,6
- -0,1
- 100,0
- 14,1
- 50,4
- 21,6
- 3,0
- 11,2
- -0,2
- 100,0
- 15,2
- 49,6
- 22,1
- 3,4
- 10,1
- -0,3
- 100,0
- 11,6
- 49,4
- 25,1
- 3,5
- 11,1
- -0,7
- 100,0
It is a well-known fact that one of the problems with wind energy is the inability to predict production, as this relies on wind speed. In places in which this sector is gaining increasing importance, as it is in Spain, there is another problem: the difficulty of taking the power produced and usefully feeding it into the system when high amounts of energy are being produced, particularly when this happens at off-peak times. This becomes a particular problem when there are insufficient international connections, as is also the case in Spain.
One of the solutions being suggested is to work towards creating increased demand during night-time hours (off-peak), which could come from the greater use of electric and hybrid vehicles. The creation of a sufficient number of power-supply points, along with a minimum target of a million vehicles are two important objectives for the near future.
One piece of information that underlines this fact is that during November 2008, the share contributed by wind energy to the overall power-generation mix varied between 1.15% and 43%.
- Coal
- Oil
- Natural gas
- Water+Wind
- Nuclear
- TOTAL
- 5,5
- 2,6
- 12,5
- 18,5
- 5,7
- 4,9
- -8,7
- 3,2
- 7,8
- 40,3
- 2,4
- 2,3
- 12,1
- 1,4
- 14,3
- -31,7
- -1,1
- 3,5
- -5,3
- 2,5
- 13,3
- 62,3
- -1,8
- 3,2
- 5,0
- 2,5
- 16,1
- -10,0
- 2,8
- 4,4
- 2,4
- 1,0
- 18,0
- -14,8
- -9,5
- 2,6
- -11,8
- -1,4
- 4,0
- 19,8
- 4,5
- -0,9
- 9,1
- 0,1
- 4,3
- 14,6
- -8,4
- 1,6
- -25,4
- -3,3
- 10,1
- 0,1
- 7,0
- -2,9
- Coal
- Oil
- Natural gas
- TOTAL (2)
- 83,5
- 2,3
- 0,0
- 29,3
- 67,5
- 5,5
- 13,0
- 35,9
- 62,3
- 1,7
- 24,6
- 34,8
- 52,6
- 1,2
- 7,2
- 30,2
- 38,6
- 0,3
- 1,0
- 23,3
- 33,1
- 0,4
- 1,3
- 21,3
- 31,3
- 0,2
- 0,5
- 21,1
- 33,8
- 0,2
- 0,2
- 21,7
- 29,0
- 0,2
- 0,1
- 20,9
- 28,4
- 0,2
- 0,0
- 21,2
(2) Out of the Total, including nuclear, hydraulic and other renewable energy sources, with 100% Spanish supply allocation.
Source: Secretaría General de la Energía.
Ministerio de Industria, Turismo y Comercio.
- Coal
- Oil
- Natural gas
- Nuclear
- Renewable Energy
- TOTAL
- 6.922
- 255
- 310
- 16.576
- 9.149
- 33.212
- 20,8
- 0,8
- 0,9
- 49,9
- 27,5
- 100,0
- 6.626
- 166
- 144
- 14.995
- 8.876
- 30.807
-
21,5
- 0,5
- 0,5
- 48,7
- 28,8
- 100,0
- 6.243
- 140
- 55
- 15.669
- 9.211
- 31.318
- 19,9
- 0,4
- 0,2
- 50,0
- 29,4
- 100,0
- 5.865
- 143
- 16
- 14.360
- 10.229
- 30.613
- 19,2
- 0,5
- 0,1
- 46,9
- 33,4
- 100,0
- 4.150
- 126
- 17
- 15.372
- 10.731
- 30.396
- 13,7
- 0,4
- 0,1
- 50,6
- 35,3
- 100,0
Source: Secretaría General de la Energía.
Ministerio de Industria, Turismo y Comercio.
- PRIMARY ENERGY
- FINAL ENERGY
- Industries
- Transports
- Residential-Commercial
- Market R-C :
- Diesel
- Natural gas
- Electricity
- Market Residential
- 3.619
- 2.368
- 730
- 696
- 942
- 219
- 270
- 227
- 626
- 3.550
- 2.298
- 670
- 703
- 925
- 163
- 318
- 245
- 600
- 3.718
- 2.388
- 663
- 738
- 986
- 158
- 362
- 272
- 628
- 3.702
- 2.386
- 658
- 751
- 977
- 150
- 353
- 279
- 617
- 2.293
- 1.452
- 509
- 573
- 370
- 82
- 15
- 130
- 238
- 3.064
- 1.983
- 636
- 820
- 527
- 127
- 66
- 212
- 296
- 3.360
- 2.264
- 723
- 920
- 621
- 149
- 101
- 263
- 352
- 3.288
- 2.209
- 688
- 933
- 588
- 119
- 92
- 271
- 337
Having analysed the way that the use of individual primary energy sources has evolved, we will now look at the share that each of them accounts for in the energy mix. Oil continued to fall below the 50% mark, though it remains above the community average, which stands at several points below 40%.
Natural gas strengthened its place at number 2, a position it has held for 5 years now. Its share of the mix (24.3% including non-marketed renewables, 25.1% of specifically marketed energy sources) is now around average for the EU, the first time this type of energy has achieved this level in Spain.
Nuclear energy provided 10.7% of all energy consumed during 2008, overtaking coal for the first time in recent years, if we exclude solid urban waste (SUW) from the latter.

-
 Eve
Eve -
 Medgaz
 -
 Grupo Gas Natural