

The advance official numbers suggest a total primary energy consumption in Spain of 131.2 million tonnes of oil equivalent (Toe).
If we take out of the equation energy not commercially sold (for example biomass consumed by households), consumption of primary energy would stand at around 126 million Toe.
- Coal
- Oil
- Natural gas
- Nuclear
- Renewable Energy
- -Hydraulic
- -Wind
- -Biomass and waste
- -Biofuels
- -Geothermal
- -Solar
- Elect. Balance (Im-Ex)
- TOTAL
- 20.354
- 70.848
- 31.602
- 14.360
- 9.967
- 2.342
- 2.387
- 4.708
- 386
- 8
- 136
- -495
- 146.636
- 13,9
- 48,3
- 21,6
- 9,8
- 6,8
- 1,6
- 1,6
- 3,2
- 0,3
- 0,0
- 0,1
- -0,3
- 100,0
- 13.983
- 68.182
- 34.782
- 15.368
- 10.942
- 2.004
- 2.795
- 5.162
- 620
- 8
- 353
- -949
- 142.308
- 9,8
- 47,9
- 24,4
- 10,8
- 7,7
- 1,4
- 2,0
- 3,6
- 0,4
- 0,0
- 0,2
- -0,7
- 100,0
- 10.353
- 63.673
- 31.104
- 13.750
- 12.325
- 2.257
- 3.196
- 5.087
- 1.058
- 9
- 718
- -697
- 130.508
- 7,9
- 48,8
- 23,8
- 10,5
- 9,4
- 1,7
- 2,4
- 3,9
- 0,8
- 0,0
- 0,6
- -0,5
- 100,0
- 8.332
- 62.179
- 31.005
- 15.400
- 15.004
- 3.605
- 3.672
- 5.190
- 1.609
- 9
- 919
- -717
- 131.203
- 6,4
- 47,4
- 23,6
- 11,7
- 11,4
- 2,7
- 2,8
- 4,0
- 1,2
- 0,0
- 0,7
- -0,5
- 100,0
(2) Provisional data at 24/01/11
LMini-hydraulic is included in hydraulic.
Source: Secretaría de Estado de la Energía. Ministerio de Industria, Turismo y Comercio.
- Coal (2)
- Oil
- Natural gas
- Hydraulic+Wind+solar (4)
- Nuclear
- Electric Balance (Im-Ex)
- TOTAL
- 18.974
- 47.741
- 5.000
- 2.205
- 14.138
- -36
- 88.022
- 18.721
- 54.610
- 7.504
- 2.000
- 14.449
- 386
- 97.670
- 22.137
- 64.663
- 15.223
- 2.943
- 16.211
- 382
- 121.559
- 22.514
- 71.765
- 29.120
- 3.527
- 14.995
- -116
- 141.805
- 21.865
- 70.848
- 31.602
- 4.703
- 14.360
- -495
- 142.963
- 15.470
- 68.182
- 34.782
- 5.023
- 15.368
- -949
- 137.876
- 11.411
- 63.673
- 31.104
- 6.014
- 13.750
- -697
- 125.255
- 9.927
- 62.179
- 31.005
- 8.196
- 15.400
- -717
- 125.990
(2) Including waste and others in electric generation.
(3) Provisional data at 24.1.2011
(4) And photovoltaic solar.
Source: Secretaría de Estado de la Energía. Ministerio de Industria, Turismo y Comercio.
In the first quarter of 2010, total primary energy consumption dropped (-2.5%) with respect to the same period in the previous year, as in previous quarters. On the other hand, final energy consumption in this first quarter broke away from the downward trend registered in previous quarters and suggested a 0.7% upturn. This shift was brought about by the budding recuperation of the industrial demand, in combination with temperature differences.
In the second quarter of the year, primary energy consumption dropped by 0.9%, a modest figure considering the data for the previous quarter. The recuperation of end demands has been key to this evolution.
The state of the Spanish economy has affected the energy demand once again. For instance, the energy consumption in 2010 was lower than in 2003. Other factors, such as the harsh climate registered during the first months of 2010 and the increase in energy efficiency also conditioned (the former caused increase, and the latter caused decrease) the energy consumption recorded for last year.
- Coal
- Oil
- Natural gas
- Water+Wind+Solar
- Nuclear
- TOTAL
- 12,1
- 1,4
- 14,7
- -32,0
- -1,1
- 3,5
- -5,3
- 2,5
- 13,3
- 63,2
- -1,8
- 3,0
- 5,0
- 2,5
- 16,0
- -10,0
- 2,8
- 4,4
- 2,3
- 1,1
- 17,6
- -14,6
- -9,5
- 2,7
- -11,8
- -1,4
- 4,1
- 19,8
- 4,5
- -0,9
- 10,2
- 0,1
- 4,3
- 13,2
- -8,4
- 1,7
- -29,2
- -3,8
- 10,1
- 5,0
- 7,0
- -3,6
- -26,2
- -6,6
- -10,5
- 19,7
- -10,5
- -9,2
- -13,0
- -2,3
- -0,6
- 36,3
- 12,0
- 0,6
- Coal
- Oil
- Natural gas
- Water+Wind+Solar
- Nuclear
- Electrical Balance (Im-Ex)
- TOTAL
- 21,6
- 54,2
- 5,7
- 2,5
- 16,1
- 0,0
- 100,0
- 19,2
- 55,9
- 7,7
- 2,0
- 14,8
- 0,4
- 100,0
- 18,2
- 53,2
- 12,5
- 2,4
- 13,3
- 0,3
- 100,0
- 15,9
- 50,6
- 20,5
- 2,5
- 10,6
- -0,1
- 100,0
- 15,3
- 49,6
- 22,1
- 3,3
- 10,0
- -0,3
- 100,0
- 11,2
- 49,5
- 25,2
- 3,6
- 11,1
- -0,7
- 100,0
- 9,1
- 50,8
- 24,8
- 4,8
- 11,0
- -0,6
- 100,0
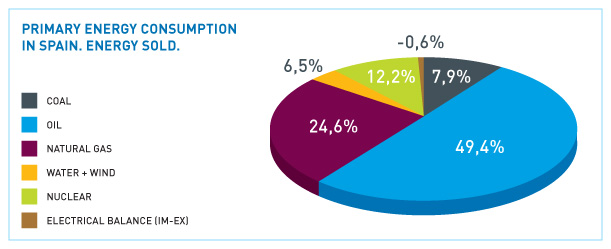
- 7,9
- 49,4
- 24,6
- 6,5
- 12,2
- -0,6
- 100,0
The evolution of the specific consumption of each primary energy source was as follows:
- The demand for coal dropped again this year. As a guideline, the sum recorded for last year stood at 41% of the sum for 2007.
- A drop (-0.3%)was also noted in natural gas consumption, as a result of the decrease of the use of natural gas in combined cycles.
- The demand for oil continued its downward trend (8.7 million less Toe than in 2007, for example), due to the crisis, increased efficiency and the shift in certain applications, such as the penetration of natural gas in the residential market.
- Nuclear generation increased (+12%), given that there were less stops last year and a slight increase was noted in actual potential.
- There has been a spectacular increase in renewable energy, which supplied Spanish society with the equivalent of 15 million Toe.
The price of coal on the international market is on a par with the price of crude oil. Therefore, the main increases were noted in the second half of the year. This fact considered alongside the significant increase in the electricity generated by renewable energies in 2010 can account for this downturn.
The situation for national coal stands the same as in 2009, with evident surplus output. The Government plan to encourage the use of coal in electrical power plants has not yet been implemented in 2010.
The consumption of coal in power stations (the most significant use of this energy) has followed the downward trend shown in previous years. In 2010, its use in plants dropped by 29%, contributing 8.6% of the electricity generated. Five years before, it contributed 25 per cent of the electricity generation.
In the first quarter of 2010, hydroelectric production increased by 88% over the 2009 period, which had already experienced major increases compared to 2008. Over the rest of the year, the upward trend ranged at similar levels, with the year closing with a 60% increase.
On the last day of 2009 water reserves with electrical exploitation stood at 52% of capacity, five points higher than at the close of 2008. On the last day of March 2010 the relation stood at 77%, at the end of June at 80%, in September at 58% and at the close of 2010 the percentage amounted to 66.7%, 14 points higher than at the end of 2009.
Oil maintains a share of around 50% of primary energy. Coal (without solid urban waste) has seen its market share fall by almost 1.5 points, contributing 7.9% of primary energy. In 1907 it contributed 15 per cent.
As a whole, wind power has contributed 14.1% of the total electricity demands.
The definition of the future energy mix remained open in 2010. The creation of a Subcommission in the Spanish Parliament, and the subsequent report, clearly outlined intentions.
In late April, the Spanish Ministry of Industry, Tourism and Trade sent the National Energy Commission (CNE, Spanish acronym) a proposal for the review of the Planning document for the electricity and gas sectors (development of carrier networks). The proposal initiates the review process for the Planning document that is currently in force (2008-2016). The new planning document, for 2011 to 2020, is expected to be endorsed in July 2011.
- Coal
- Oil
- Natural Gas
- TOTAL (3)
- 67,5
- 5,5
- 13,0
- 35,9
- 60,7
- 1,7
- 24,6
- 34,0
- 53,1
- 1,2
- 7,2
- 28,2
- 40,0
- 0,3
- 1,0
- 23,3
- 31,3
- 0,2
- 0,5
- 21,1
- 33,8
- 0,2
- 0,2
- 21,7
- 28,8
- 0,2
- 0,0
- 20,7
- 31,3
- 0,2
- 0,0
- 21,7
- 36,5
- 0,2
- 0,0
- 23,0
- 38,1
- 0,2
- 0,1
- 25,7
(2) Provisional data at 24/1/2011
(3) Out of the Total, including nuclear, hydraulic and other renewable energy sources, with 100% Spanish supply allocation.
Source: Secretaría de Estado de Energía.
Ministerio de Industria, Turismo y Comercio
- Coal
- Oil
- Natural gas
- Nuclear
- Renewable Energy
- TOTAL
- 6.243
- 140
- 55
- 15.669
- 9.211
- 31.318
- 19,9
- 0,4
- 0,2
- 50,0
- 29,4
- 100,0
- 5.865
- 143
- 16
- 14.360
- 9.966
- 30.350
- 19,3
- 0,5
- 0,1
- 47,3
- 32,8
- 100,0
- 4.374
- 127
- 14
- 15.368
- 10.942
- 30.825
- 14,2
- 0,4
- 0,0
- 49.9
- 35,5
- 100,0
- 3.778
- 107
- 12
- 13.750
- 12.326
- 29.973
- 12,6
- 0,4
- 0,0
- 45,9
- 41,1
- 100,0
- 3.174
- 130
- 30
- 15.400
- 15.004
- 33.738
- 9,4
- 0,4
- 0,1
- 45,6
- 44,5
- 100,0
(2) Provisional data at 24.1.2011
Source: Secretaría de Estado de Energía. Ministerio de Industria, Turismo y Comercio
The intention to promote European coal over the coming years, to guarantee its use in generation, has held part of the attention of the energy system stakeholders. The European Commission endorsed the extension of these aids until late 2014. Subsequently, in December (OJEU 10.12.2010) these aids were extended until the end of 2018, implementing a progressive reduction over a specific timeframe. In Spain, a Royal Decree has been drafted, but not yet implemented, requesting the electric pool to consume a specific amount of electric energy from autochthonous coal.
The Report from the Subcommission on the analysis of the Spanish energy strategy for the coming 25 years foresees that as regards efficiency, the consumption of primary energy in 2020 will be 5.66% above the figure for 2009. The consumption of natural gas is expected to increase by 27.7% over that period.
Natural gas is growing in importance in the Spanish energy balance despite the fact that the increases in the demand expected for this energy are lower than in past years: 6.1% annual increase in 2001-2005 and an estimated 2.3% annual growth for the 2010-2020 period.
- OF FINAL ENERGY
- 3.461
- 3.550
- 3.716
- 3.616
- 1.924
- 3.064
- 3.360
- 3.133
- Coal
- Oil
- Natural gas
- Nuclear
- Renewable Energy
- Electrical Balance (Im-Ex)
- TOTAL
- 10,583
- 63,674
- 31,078
- 13,742
- 12,178
- -697
- 130,558
- 8.1
- 48.8
- 23.8
- 10.5
- 9.3
- -0.5
- 100.0
- 10,046
- 50,527
- 39,699
- 14,490
- 25,150
- -1,963
- 137,949
- 7.3
- 36.6
- 28.8
- 10.5
- 18.2
- -1.4
- 100.0
- Coal
- Oil
- Natural gas
- Nuclear
- Renewable Energy
- Electrical Balance (Im-Ex)
- TOTAL
- 21,183
- 71,765
- 29,116
- 14,995
- 8,371
- -116
- 145,314
- 14.6
- 49.4
- 20.0
- 10.3
- 5.8
- -0.1
- 100.0
- 9,198
- 60,594
- 32,314
- 14,594
- 13,966
- -688
- 129,978
- 7.1
- 46.6
- 24.9
- 11.2
- 10.7
- -0.5
- 100.0
- 10,641
- 58,132
- 38,402
- 14,490
- 19,798
- -688
- 140,775
- 7.6
- 41.3
- 27.3
- 10.3
- 14.1
- -0.5
- 100.0
- 10,533
- 59,360
- 45,141
- 14,490
- 28,095
- -688
- 156,931
- 6.7
- 37.8
- 28.8
- 9.2
- 17.9
- -0.4
- 100.0
Ministerio de Industria, Turismo y Comercio and IDAE. June 2010